3 Circle Venn. Venn Diagram Example
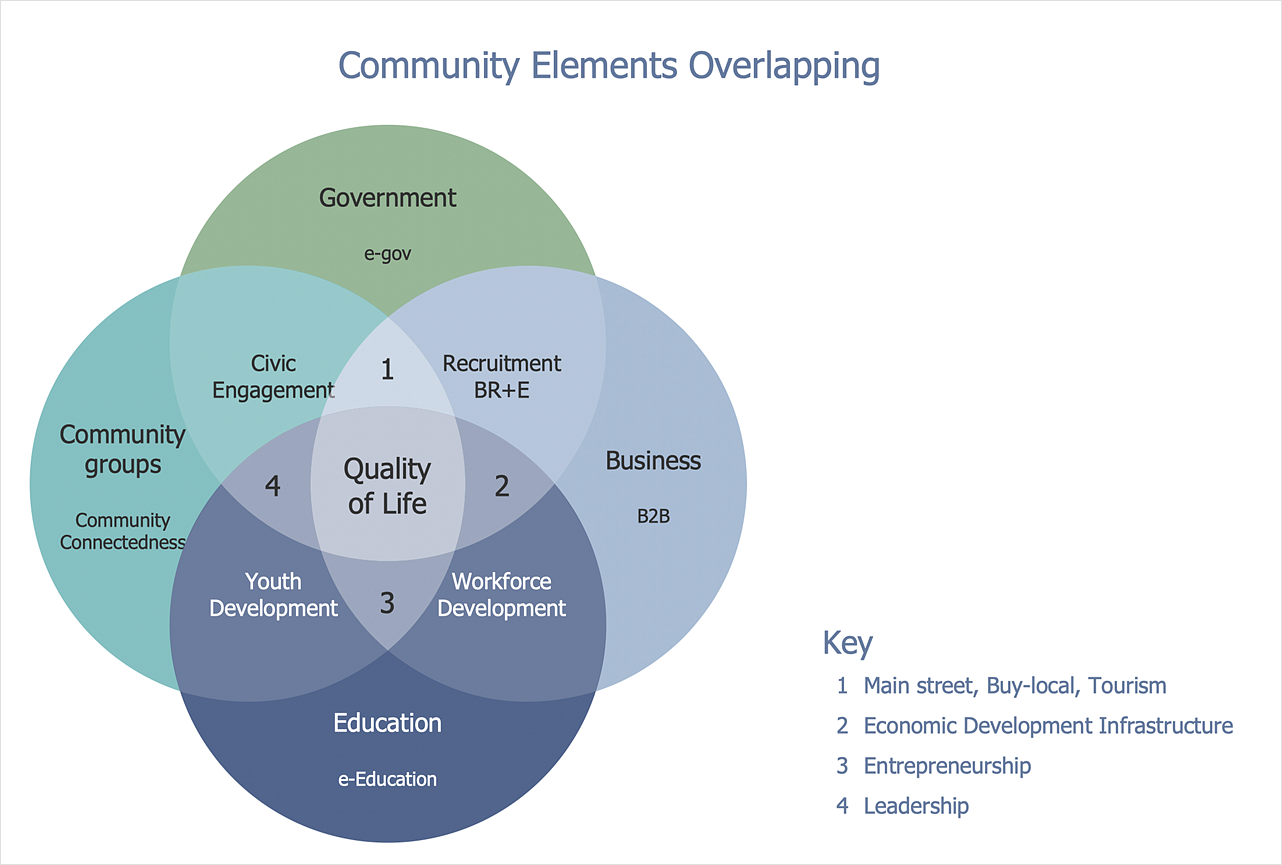
This example shows the 3 Circle Venn Diagram. The Venn Diagrams visualize all possible logical intersections between several sets. On this example you can see the intersections of 3 sets. Venn Diagrams are widely used in mathematics, logic, statistics, marketing, sociology, etc.Venn Diagram Examples for Problem Solving. Computer Science. Chomsky Hierarchy
A Venn diagram, sometimes referred to as a set diagram, is a diagramming style used to show all the possible logical relations between a finite amount of sets. In mathematical terms, a set is a collection of distinct objects gathered together into a group, which can then itself be termed as a single object. Venn diagrams represent these objects on a page as circles or ellipses, and their placement in relation to each other describes the relationships between them. The Venn diagram example below visualizes the the class of language inclusions described by the Chomsky hierarchy.Hierarchical Network Topology
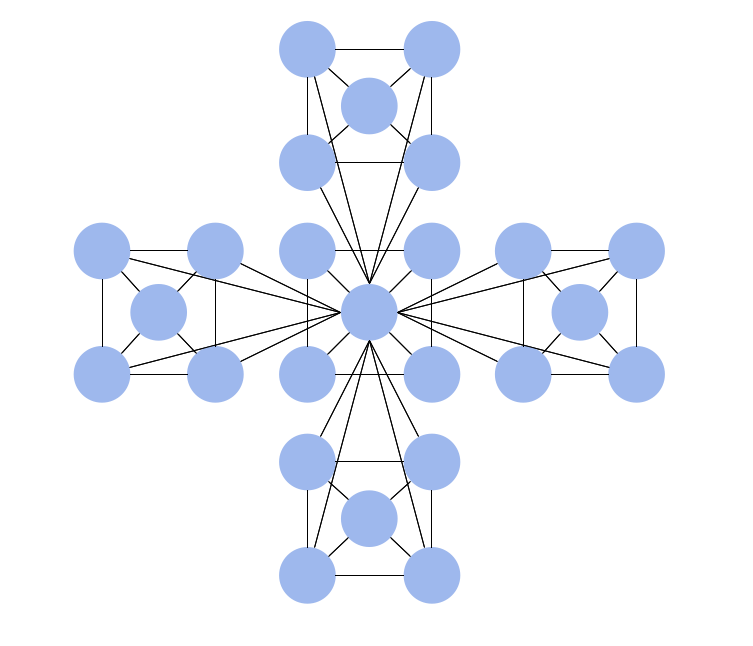
This sample was created in ConceptDraw DIAGRAM diagramming and vector drawing software using the Computer and Networks solution from Computer and Networks area of ConceptDraw Solution Park. This sample shows the Hierarchical network topology. A Hierarchical network topology interconnects multiple groups that are located on the separate layers to form a larger network. Each layer concentrates on the specified functions, this allows to choose the right equipment for the layer.Basic Network Diagram
The Basic Network Diagram is an easy and effective way to design and document a simple network, it lets to represent visually and logically how the different network devices and computer equipment can be installed to meet the main business needs. ConceptDraw DIAGRAM software supplied with Computer Network Diagrams solution from the Computer and Networks area of ConceptDraw Solution Park is a perfect tool for drawing the Basic Computer Network diagrams, designs, schematics, and maps, network architectures, topologies, and layouts. Numerous vector libraries of network symbols, icons and components are incredibly helpful for IT and telecom engineers, stakeholders and end-users when designing Basic Network Diagrams, Common Network Diagrams, Common Network Topologies, 10Base-T Star Network Topologies, Bus Topology Diagrams, Communication Network Diagrams, System Designs, Regional Cable Head-End Diagrams, etc. Collection of predesigned samples and templates included to Computer Network Diagrams solution also greatly extends the capabilities of ConceptDraw DIAGRAM users.
Circuits and Logic Diagram Software
Circuit diagram is a graphical representation of electrical circuits, wire connections between devices, among them power and signal connections. Circuit diagrams are successfully used during design, construction and maintenance of different electrical and electronic equipment, and also for visualizing expressions using a boolean algebra in the computer science. These diagrams don't show a physical arrangement of components. One of advanced application of ConceptDraw DIAGRAM software is electrical engineering. Included to ConceptDraw Solution Park, Electrical Engineering solution from the Engineering area offers templates, samples and incredibly large quantity of vector design elements of circuits and logic symbols, which are helpful for professional drawing Circuit diagrams, Logic circuit diagrams, Wiring diagrams, Electrical schematics, Digital and Analog logic designs, Integrated circuit schematics, Circuit board and Amplifier diagrams, Power systems diagrams, Maintenance and Repair diagrams of any difficulty.HelpDesk
How to Create a Venn Diagram
Venn diagrams were invented by John Venn as a method of depicting relationships between different components. A Venn diagram consists of two or more circles. Each circle represents a specific group or set. The entities which are depicted by circles generally have some common characteristics. A Venn Diagram shows all the possible logical relations between these entities. Any properties that belong to more than one set should be indicated in the sections where the circles overlap. A Venn Diagram can be useful to visually summarize the status and future viability of a project. ConceptDraw DIAGRAM allows you to make Venn diagrams using the Venn Diagrams solution.
 Cisco Network Diagrams
Cisco Network Diagrams solution extends ConceptDraw DIAGRAM with the best characteristics of network diagramming software. Included samples, templates and libraries of built-in standardized vector Cisco network icons and Cisco symbols of computers, network devices, network appliances and other Cisco network equipment will help network engineers, network designers, network and system administrators, as well as other IT professionals and corporate IT departments to diagram efficiently the network infrastructure, to visualize computer networks topologies, to design Cisco computer networks, and to create professional-looking Cisco Computer network diagrams, Cisco network designs and schematics, Network maps, and Network topology diagrams in minutes.
 Computer Network Diagrams
Computer Network Diagrams solution extends ConceptDraw DIAGRAM software with samples, templates and libraries of vector icons and objects of computer network devices and network components to help you create professional-looking Computer Network Diagrams, to plan simple home networks and complex computer network configurations for large buildings, to represent their schemes in a comprehensible graphical view, to document computer networks configurations, to depict the interactions between network's components, the used protocols and topologies, to represent physical and logical network structures, to compare visually different topologies and to depict their combinations, to represent in details the network structure with help of schemes, to study and analyze the network configurations, to communicate effectively to engineers, stakeholders and end-users, to track network working and troubleshoot, if necessary.
MS Visio Look a Like Diagrams
No need for any special drawing skills to create professional looking diagrams outside of your knowledge base. ConceptDraw DIAGRAM takes care of the technical details, allowing you to focus on your job, not the drawing. ConceptDraw DIAGRAM delivers full-functioned alternative to MS Visio. ConceptDraw DIAGRAM supports import of Visio files. ConceptDraw DIAGRAM supports flowcharting, swimlane, orgchart, project chart, mind map, decision tree, cause and effect, charts and graphs, and many other diagram types.Simple Drawing Applications for Mac
ConceptDraw gives the ability to draw simple diagrams like flowcharts, block diagrams, bar charts, histograms, pie charts, divided bar diagrams, line graphs, area charts, scatter plots, circular arrows diagrams, Venn diagrams, bubble diagrams, concept maps, and others.
 Active Directory Diagrams
Active Directory Diagrams solution significantly extends the capabilities of ConceptDraw DIAGRAM software with special Active Directory samples, convenient template and libraries of Active Directory vector stencils, common icons of sites and services, icons of LDPA elements, which were developed to help you in planning and modelling network structures and network topologies, in designing excellently looking Active Directory diagrams, Active Directory Structure diagrams, and Active Directory Services diagram, which are perfect way to visualize detailed structures of Microsoft Windows networks, Active Directory Domain topology, Active Directory Site topology, Organizational Units (OU), and Exchange Server organization.
 Network Layout Floor Plans
Network Layout Floor Plans solution extends ConceptDraw DIAGRAM software functionality with powerful tools for quick and efficient documentation the network equipment and displaying its location on the professionally designed Network Layout Floor Plans. Never before creation of Network Layout Floor Plans, Network Communication Plans, Network Topologies Plans and Network Topology Maps was not so easy, convenient and fast as with predesigned templates, samples, examples and comprehensive set of vector design elements included to the Network Layout Floor Plans solution. All listed types of plans will be a good support for the future correct cabling and installation of network equipment.
The Best Mac Software for Diagramming or Drawing
ConceptDraw DIAGRAM is a powerful intelligent vector graphics engine that can be used to create basic diagrams including flowcharts, charts, workflows, flowcharts, organizational charts, business diagram, learn business diagrams, flow diagrams.
- Hierarchical Network Topology | Venn Diagram Examples for ...
- Problem Solving Examples Global Venn Diagram
- Basic Diagramming | Fully Connected Network Topology Diagram ...
- Venn Diagram Examples for Problem Solving. Venn Diagram as a ...
- Mathematical Diagrams | Basic Flowchart Symbols and Meaning ...
- Logical network topology diagram | Circuits and Logic Diagram ...
- Venn Diagram Template for Word | Fully Connected Network
- Venn Diagram Examples for Problem Solving. Environmental Social ...
- Circuits and Logic Diagram Software | Venn Diagram Examples for ...
- 3D Network Diagram Software | Mathematics | Venn Diagram ...
- Basic Flowchart Symbols and Meaning | Venn Diagram Examples ...
- Cylinder Venn Diagram | Interactive Venn Diagram | Venn Diagram ...
- Venn Diagram Examples for Problem Solving. Venn Diagram as a ...
- Venn Diagram Image
- Venn Diagrams | Venn Diagram | Venn Diagram Examples for ...
- Circuits and Logic Diagram Software | Venn Diagram Examples for ...
- Topology Mathematics Symbols Chart
- Basic Flowchart Symbols and Meaning | Venn Diagram Examples ...
- Network diagrams with ConceptDraw PRO | Chemistry Drawings ...
- Venn Diagram Template for Word | 3 Circle Venn. Venn Diagram ...


