Total Quality Management Definition
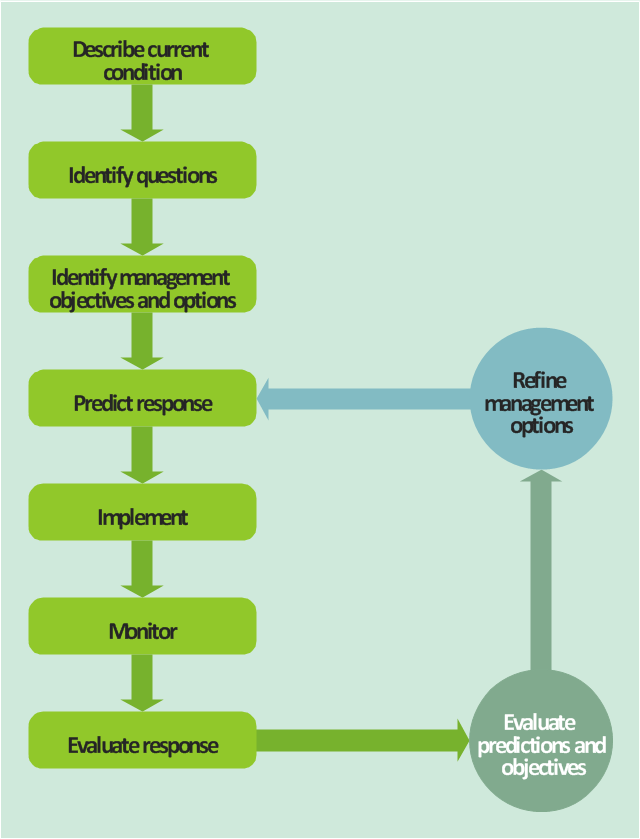
The Total Quality Management Diagram solution helps you and your organization visualize business and industrial processes. Create Total Quality Management diagrams for business process with ConceptDraw software.This TQM diagram sample was redesigned from the illustration of "Inland acid sulfate soil and water quality fact sheet" from website of the Department of the Environment of the Australian Government.
[environment.gov.au/ resource/ inland-acid-sulfate-soil-and-water-quality-fact-sheet]
"Adaptive management (AM), also known as adaptive resource management (ARM), is a structured, iterative process of robust decision making in the face of uncertainty, with an aim to reducing uncertainty over time via system monitoring. In this way, decision making simultaneously meets one or more resource management objectives and, either passively or actively, accrues information needed to improve future management. Adaptive management is a tool which should be used not only to change a system, but also to learn about the system (Holling 1978). Because adaptive management is based on a learning process, it improves long-run management outcomes. The challenge in using the adaptive management approach lies in finding the correct balance between gaining knowledge to improve management in the future and achieving the best short-term outcome based on current knowledge (Allan & Stankey 2009)." [Adaptive management. Wikipedia]
The TQM flowchart example "Acid sulfate soil adaptive management framework" was created using the ConceptDraw PRO diagramming and vector drawing software extended with the Total Quality Management (TQM) Diagrams solution from the Quality area of ConceptDraw Solution Park.
Quality Management System
ConceptDraw PRO diagramming and vector drawing software extended with Total Quality Management (TQM) Diagrams solution from the Quality area of ConceptDraw Solution Park perfectly suits for development and visually representing a Quality Management System.Total Quality Management
ConceptDraw PRO diagramming and vector drawing software extended with Total Quality Management (TQM) Diagrams solution from the Quality area of ConceptDraw Solution Park is effective software for Total Quality Management.IDEF9 Standard
Use Case Diagrams technology. An effective management of changes is significantly facilitated by way of definition and documenting of business-requirements.
 Bubble Diagrams
Bubble diagrams solution extends ConceptDraw PRO software with templates, samples and library of vector stencils for drawing the bubble diagrams.
 Enterprise Architecture Diagrams
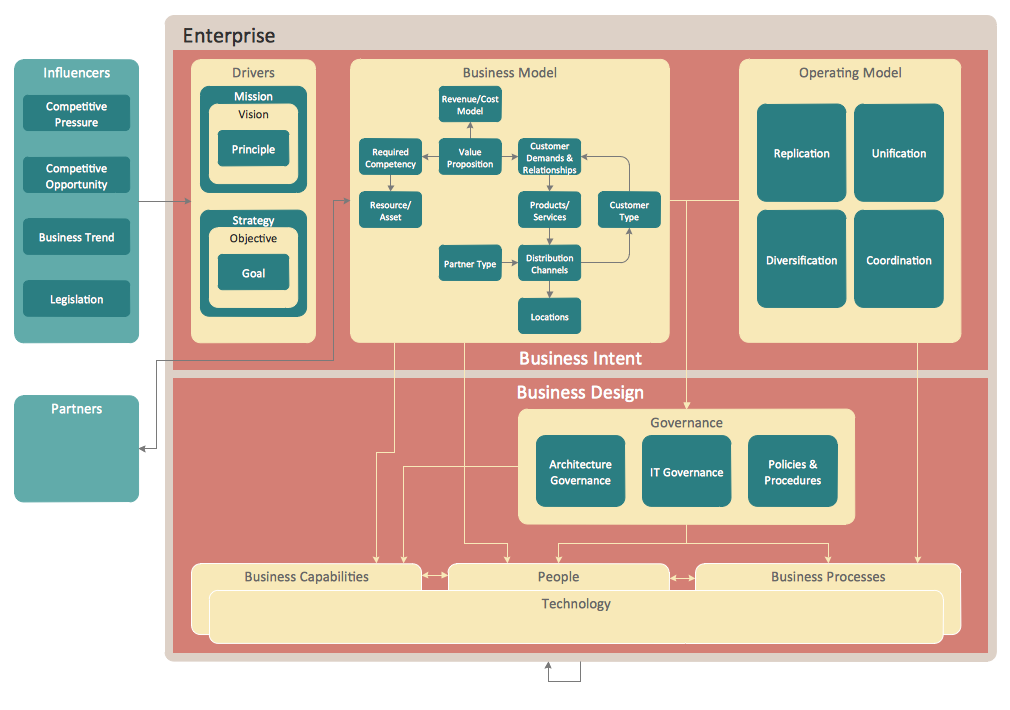
Enterprise Architecture Diagrams solution extends ConceptDraw PRO software with templates, samples and library of vector stencils for drawing the diagrams of enterprise architecture models.
HelpDesk
How to Create an Enterprise Architecture Diagram in ConceptDraw PRO
An Enterprise Architecture (EA) diagram is used to display the structure and operations of an organization.It is used to analyze and document an organization and its business functions, along with the applications and systems on which they are implemented. The aim of an enterprise architecture diagram is to determine how an organization can effectively achieve its current and future objectives. The Enterprise Architecture often uses diagrams to support the decision-making process. ConceptDraw PRO allows you to design Enterprise Architecture diagrams of any complexity.HelpDesk
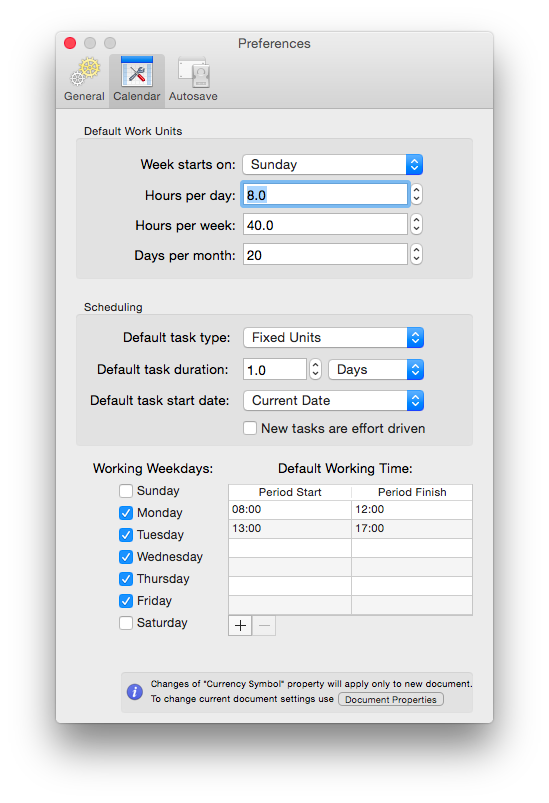
How to Change the Working Time in a Project
Project calendar determines working and non-working time of the project. It is used as a base to the project schedule development. There two types of project calendars: Project Calendar - which sets the working time for the whole project; and the Resource Calendar- which sets the working time of the particular project resource. The following article describes how to change the default calendar in ConceptDraw PROJECT.
 Word Exchange
This solution extends ConceptDraw MINDMAP software with the ability to quickly create the framework for a future article or book, fill the structure with ideas, and use it to produce an MS Word document with just a simple click of the mouse.
 Event-driven Process Chain Diagrams
Event-driven Process Chain (EPC) Diagram is a type of flowchart widely used for modeling in business engineering and reengineering, business process improvement, and analysis. EPC method was developed within the Architecture of Integrated Information Systems (ARIS) framework.
 Target and Circular Diagrams
This solution extends ConceptDraw PRO software with samples, templates and library of design elements for drawing the Target and Circular Diagrams.
 Project Management Area
Project Management area provides Toolbox solutions to support solving issues related to planning, tracking, milestones, events, resource usage, and other typical project management functions.
- Framework Of Total Quality Management With Diagram
- Total Quality Management TQM Diagrams | Acid sulfate soil ...
- Total Quality Management Definition | Acid sulfate soil adaptive ...
- Acid sulfate soil adaptive management framework | Seven Basic ...
- Data Flow Diagrams (DFD) | Acid sulfate soil adaptive management ...
- Total Quality Management Definition | TQM Diagram Example ...
- Process Flowchart | Basic Flowchart Symbols and Meaning | TQM ...
- Total Quality Management TQM Diagrams | Software workflow ...
- Total Quality Management Value | Basic Flowchart Symbols and ...
- Quality Control Chart Software — ISO Flowcharting | Create TQM ...
- Entity-Relationship Diagram (ERD) | Visio Exchange | Event-driven ...
- Total Quality Management TQM Diagrams | Seven Management and ...
- Example For A Tqm Flowchart
- Basic Flowchart Symbols and Meaning | Flowchart design ...
- Organizational Structure Total Quality Management | A Study of the ...
- Total Quality Management TQM Diagrams | Identifying Quality ...
- Framework Of Process Design By Means Of A Block Diagram
- Mobile cloud architecture diagram | Total Quality Management TQM ...
- Seven Management and Planning Tools | Total Quality Management ...
- Seven Management and Planning Tools | TQM Diagram Example ...


