Organizational Structure Total Quality Management
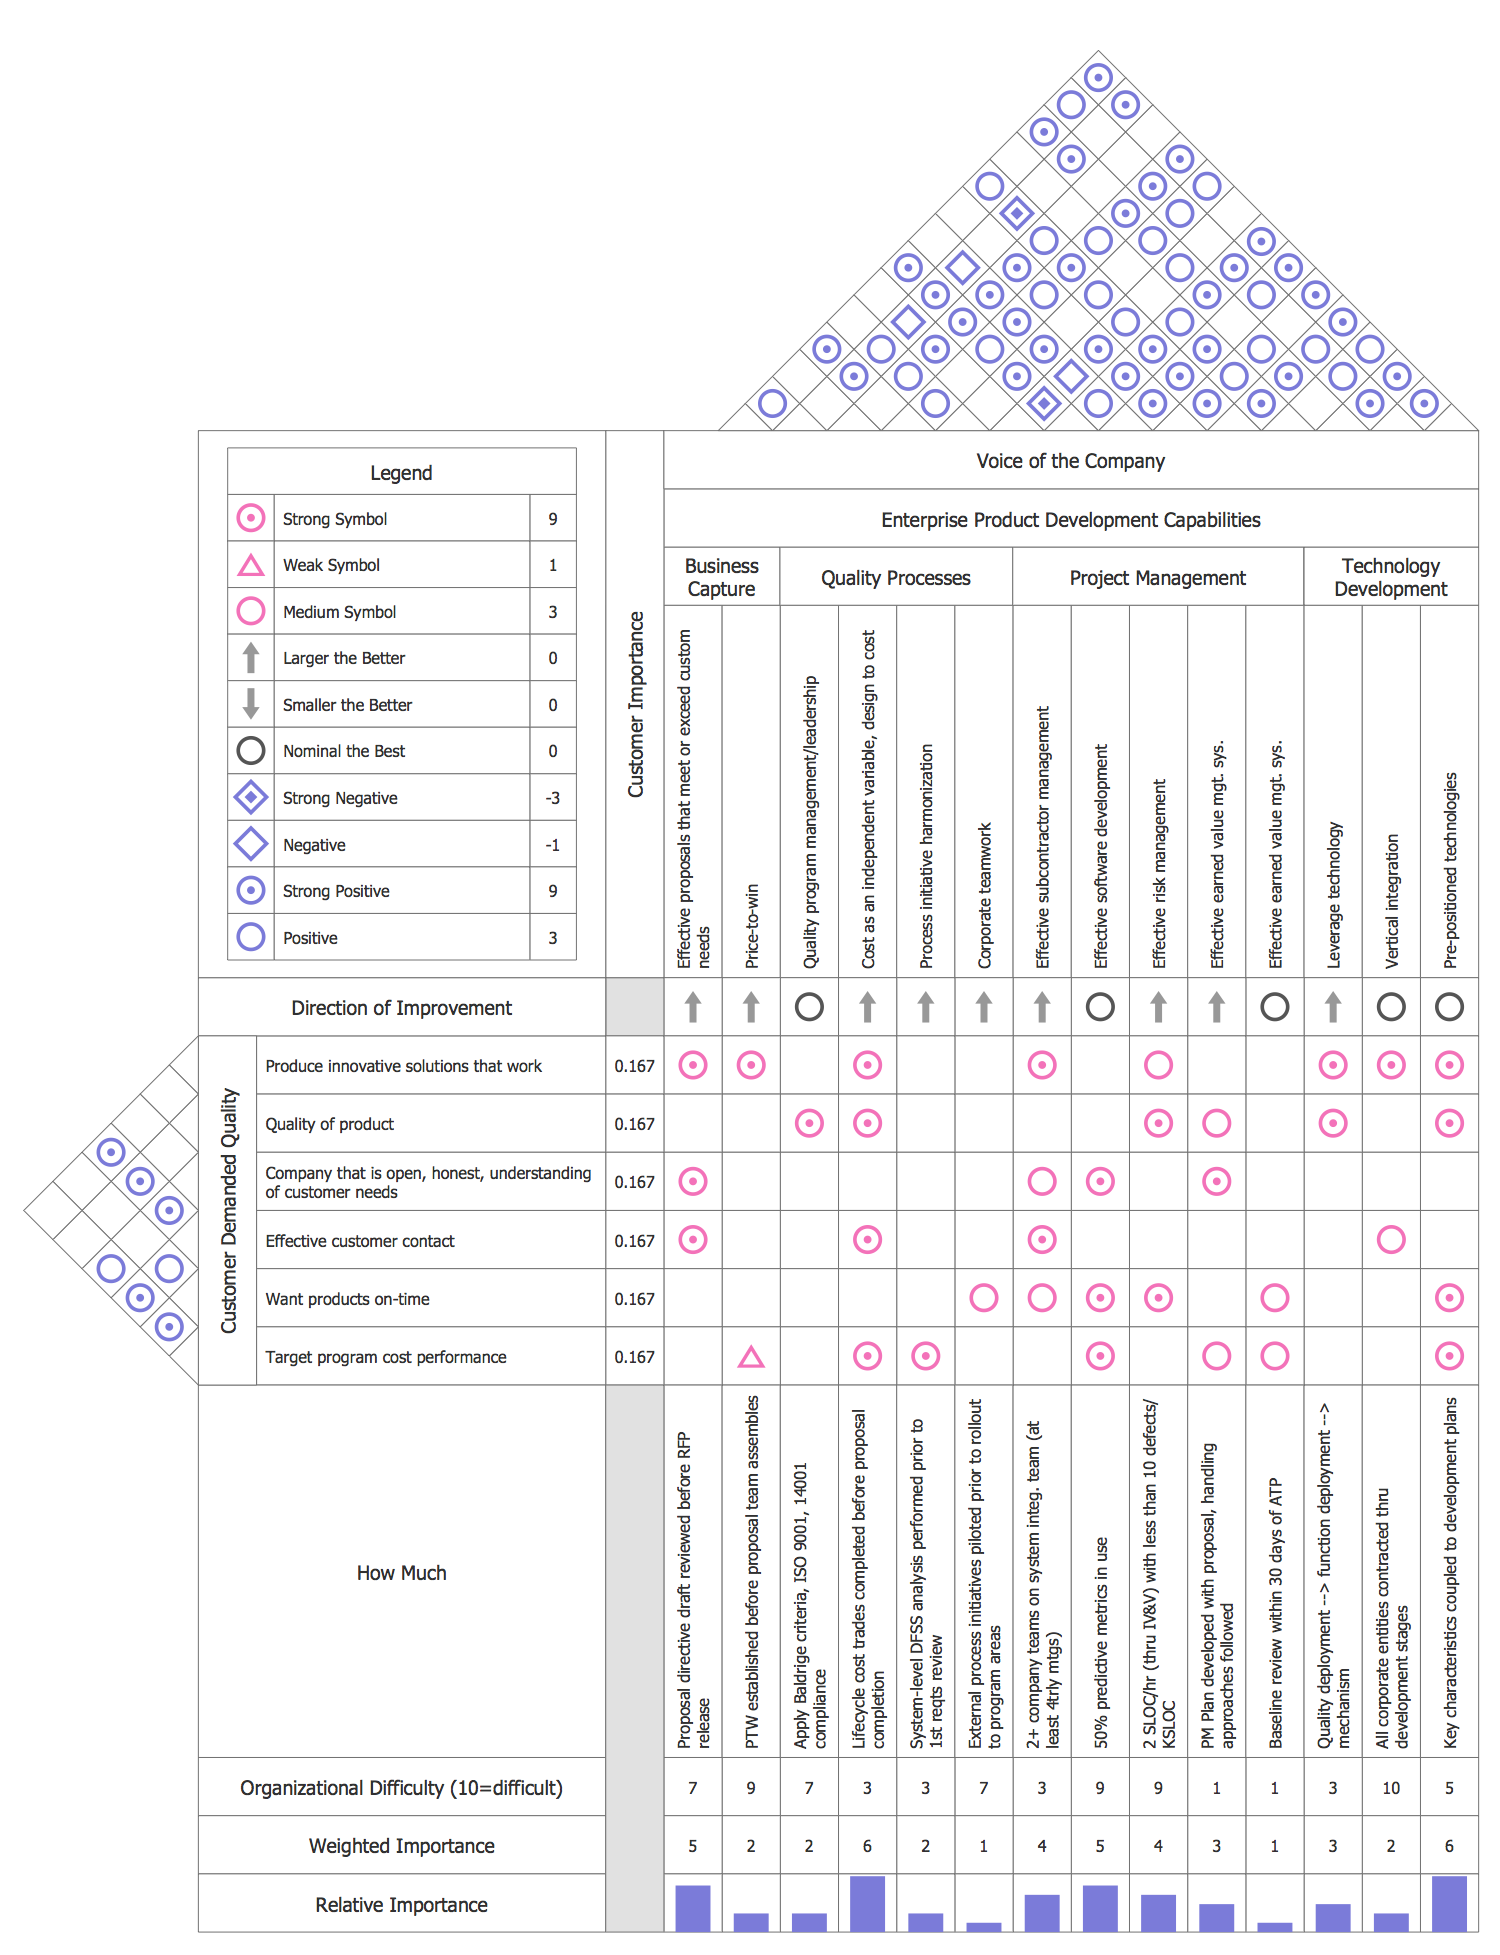
The Total Quality Management Diagram solution helps you and your organization visualize business and industrial processes. Create Total Quality Management diagrams for business process with ConceptDraw software.Management Tools — Total Quality Management
The Total Quality Management Diagram solution helps your organization visualize business and industrial processes. Create Total Quality Management diagrams for business process with ConceptDraw software.Total Quality Management
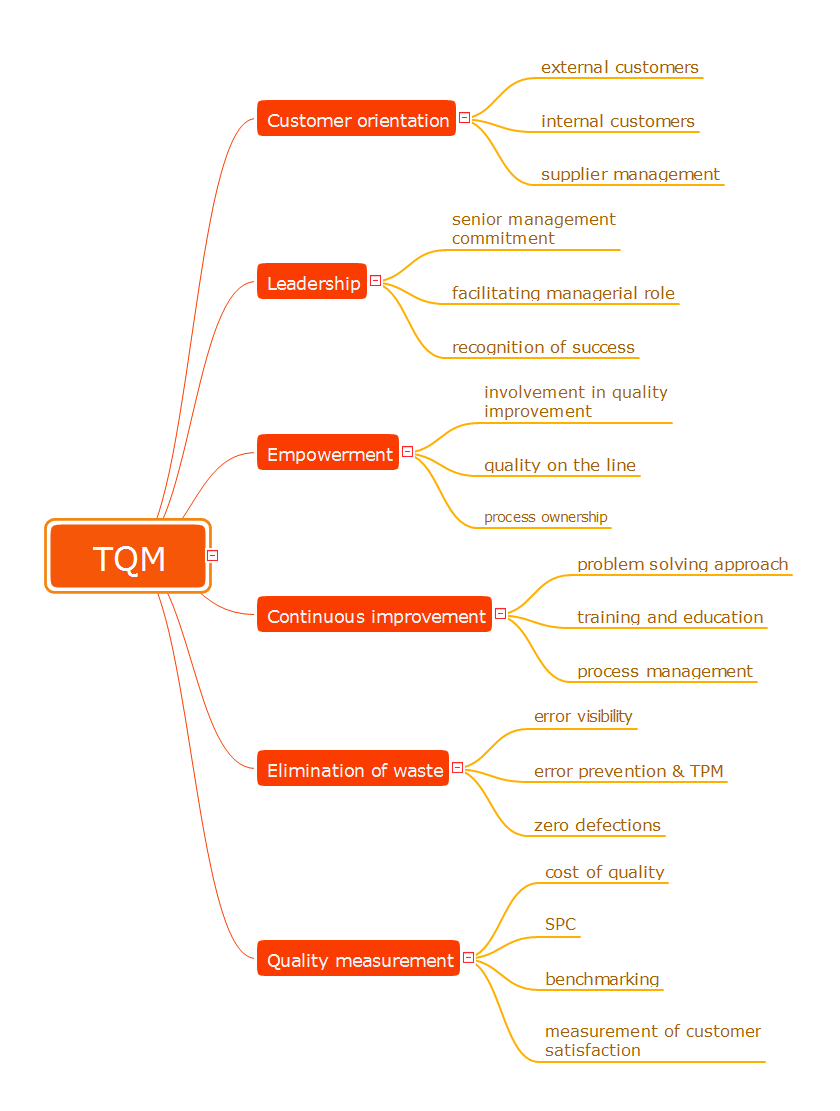
The desire to encourage the production of competitive goods led to the establishment of new method of continuous quality improvement of all organizational processes, production and service. This method successfully launched in Japan and the USA was named Total Quality Management (TQM). Now, the TQM is a dynamically developed concept, a strategic approach to management that is based on manufacturing goods or services of the best quality among innovative counterparts from the point of view of consumers. The main idea of TQM is that the company should work not only on the product quality, but also on the quality of company's work, including the work of staff. The constant parallel improvement of product quality, quality of organization processes, level of qualification the personnel allow to achieve more rapid and effective business development. Mind Maps are effective in a field of quality management and allow to structure all key quality points on one page. This Mind Map designed in ConceptDraw MINDMAP software illustrates the well-known Total Quality Management (TQM) methodology.Total Quality Management
Apart from a well-known quality management, there is also such term as a Total quality management that consists of some particular organization-wide efforts that are taken in order to install and to make permanent some definite climate in which an organization can continuously improve its ability to deliver only high-quality products/services to its customers.Total quality management techniques are known to be drawing on the previously developed ones used within the quality control. Total quality management enjoyed widespread attention during the early 1990s before being overshadowed by Lean manufacturing, ISO 9000 and Six Sigma.
Flowchart Components
The ConceptDraw Flowchart component includes a set of samples and templates. This geathered as flowchart maker toolbox which focused on drawing flowcharts of any industry standards.Matrix Organization Structure
Matrix organizational structure is one of the main forms of structures which is actively used by organizations to carry forth the functions of a company visually and effectively. Now we have ConceptDraw DIAGRAM diagramming and vector drawing software extended with 25 Typical Orgcharts solution from the Management area of ConceptDraw Solution Park which will help easy represent matrix organizational structure of any degree of complexity.Gane Sarson Diagram
The Gane-Sarson methodology uses the graphical techniques for building the logical models for the systems. It is helpful for analysts and designers to make common and clear picture of the system, to depict all its processes and how they transform the data. The Gane-Sarson methodology lets represent all this information in a way understandable for the users and other interested people, and gives the possibility to see instantly how the system's parts serve together to meet their needs. This methodology supposes the building of a system top-down. First you need create an overall system data flow, then determine the details of the data structures, the process logic and design the modular structures. ConceptDraw DIAGRAM diagramming and vector drawing software offers the Data Flow Diagrams solution with Gane-Sarson Notation library rich for the specific symbols of the Gane-Sarson notation. All they are vector and fully ready-to-use for drawing the Data Flow Diagrams, which will be then successfully used in presentations, websites, and various business documents.Diagrams Mean Nothing
You are probably familiar with diagrams. But have you ever thought that they are useless? This article will explain you why.
 EXPRESS-G data Modeling Diagram
EXPRESS-G data Modeling Diagram solution extends the ConceptDraw DIAGRAM software functionality with capabilities of EXPRESS data modeling language, includes powerful data modeling tools, Express-G diagram tool, database diagram tool, database design tool, wide variety of pre-made vector objects of EXPRESS-G notation and EXPRESS-G diagrams samples allowing software developers, software designers, software engineers and other stakeholders to make their data models for information systems, to develop the databases, to learn the principles of construction EXPRESS-G diagrams and helping to draw their own EXPRESS-G Data Modeling Diagrams, Express-G Diagrams or Database Model Diagram without any efforts.
 ATM UML Diagrams
The ATM UML Diagrams solution lets you create ATM solutions and UML examples. Use ConceptDraw DIAGRAM as a UML diagram creator to visualize a banking system.
- Tqm Model Diagram And Explanation
- Process Flowchart | TQM Diagram Example | Definition TQM ...
- Total Quality Management Definition | Process Flowchart | Block ...
- Tqm Building Blocks Model
- Tqm Building Block Model Diagram
- Different Types Of Tqm Models
- Draw Model Of Tqm
- Fishbone Diagram | Explain Service Quality Model With Diagram
- Definition TQM Diagram | TQM Diagram Example | TQM diagram ...
- Basic Flowchart Symbols and Meaning | Design elements - TQM ...


