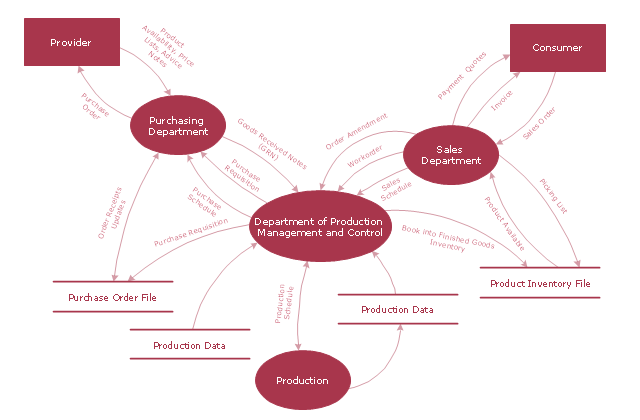
Data Flow Diagram Model
Data Flow Diagram (DFD) is a technique of graphical structural analysis, describing the sources external to the system, recipients of data, also logical functions, data flows and data stores that are accessed. The DFD's goal is to show how each process converts its inputs into the outputs and to identify relationships between these processes, at this make the system's description clear and understandable at every level of detail. Historically happened that for describing Data Flow Diagrams are used two notations - Yourdon and Gane-Sarson that differ each from other by graphical representation of symbols. The DFD model, like most other structural models is a hierarchical model. Each process can be subjected to decomposition on the structural components, the relationships between which in the same notation can be shown on a separate diagram. Typically, several DFD models are built when modeling the system. ConceptDraw DIAGRAM software enhanced with Data Flow Diagrams solution ideally suits for creation DFD models and professional drawing Data Flow Diagrams."A data flow diagram (DFD) is a graphical representation of the "flow" of data through an information system. It differs from the flowchart as it shows the data flow instead of the control flow of the program. A data flow diagram can also be used for the visualization of data processing (structured design). Data flow diagrams were invented by Larry Constantine, the original developer of structured design, based on Martin and Estrin's "data flow graph" model of computation.
It is common practice to draw a context-level Data flow diagram first which shows the interaction between the system and outside entities. The DFD is designed to show how a system is divided into smaller portions and to highlight the flow of data between those parts. This context-level Data flow diagram is then "exploded" to show more detail of the system being modeled" [Data model. Wikipedia]
The DFD (Yourdon and Coad notation) example "Model of small traditional production enterprise" was created using the ConceptDraw PRO diagramming and vector drawing software extended with the Data Flow Diagrams solution from the Software Development area of ConceptDraw Solution Park.
Network Glossary Definition
The network glossary contains a complete list of network, computer-related and technical terms in alphabetic order, explanations and definitions for them, among them there are words well known for you and also specific, rare-used, uncommon or newly introduced terms. This specialized glossary, also known as a vocabulary, is the best in its field and covers in details the various aspects of computer network technologies. This glossary was developed by specialists using the practical experience and many useful sources to help the ConceptDraw users in their work, you can read and learn it from the screen on-line or print, it can be also used as a perfect educational guide or tutorial. ConceptDraw DIAGRAM software extended with Computer and Networks solution is easy to draw various types of Network diagrams, Network topology diagrams, Computer networking schematics, Network maps, Cisco network topology, Computer network architecture, Wireless networks, Vehicular networks, Rack diagrams, Logical, Physical, Cable networks, etc. Desktop ConceptDraw DIAGRAM Software is a good Visio for Mac Os X replacement. It gives you rich productivity and quality of the produced diagrams.
- Data Flow Diagram Model | DFD - Model of small traditional ...
- Data Flow Diagram Model | Process Flowchart | DFD - Model of ...
- Data flow Model Diagram | DFD, Gane-Sarson notation - Template ...
- Data Flow Diagram Example Students Details
- Detailed Data Flow Diagram
- Data Flow Diagram Model | Process Flowchart | Process Flow Maps ...
- Process Flowchart | Data Flow Diagram Model | Cause and Effect ...
- Data Flow Diagram (DFD)
- Data Flow Diagram (DFD)
- Data Flow Diagram Model | Example of DFD for Online Store (Data ...
- Data flow Model Diagram
- Data Flow Diagram Symbols. DFD Library
- Data Flow Diagram (DFD) | Data Flow Diagram Symbols. DFD ...
- Data Flow Diagram Symbols. DFD Library
- Data Flow Diagram (DFD)
- ConceptDraw PRO DFD Software | Data Flow Diagram Model ...
- Context Diagram Template | Data Flow Diagram (DFD) | Data Flow ...
- Context Diagram Template | DFD Library System | Data Flow ...
- Data Flow Diagram Symbols. DFD Library
- Data Flow Diagram (DFD)


