UML Deployment Diagram Example - ATM System UML diagrams

 ATM UML Diagrams
The ATM UML Diagrams solution lets you create ATM solutions and UML examples. Use ConceptDraw DIAGRAM as a UML diagram creator to visualize a banking system.
Financial Trade UML Use Case Diagram Example

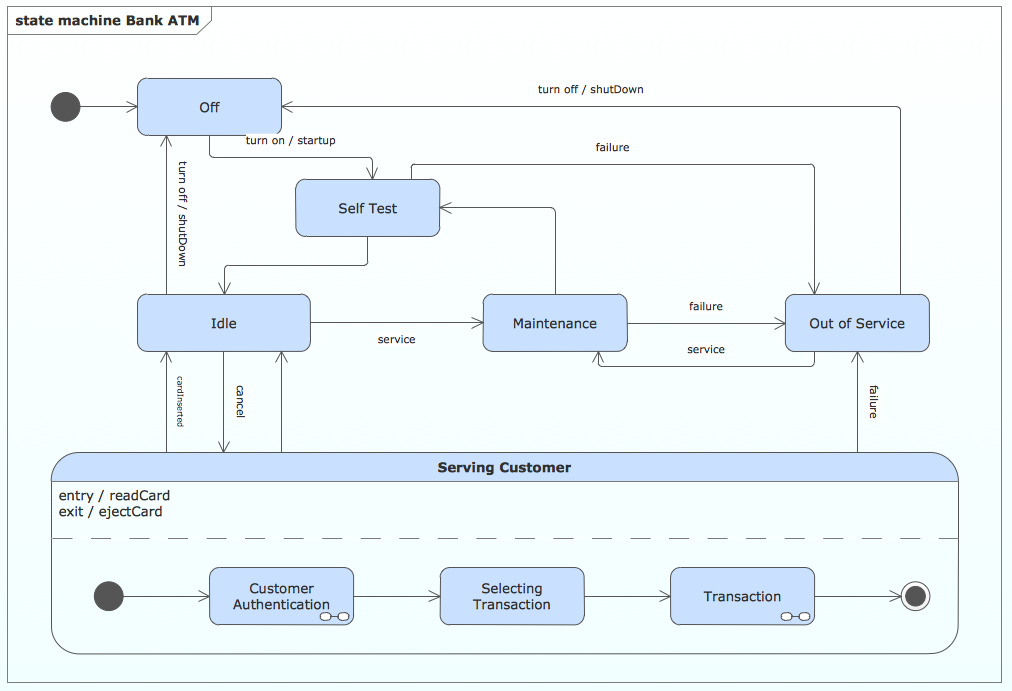
State Machine Diagram

UML Use Case Diagram Example. Services UML Diagram. ATM system

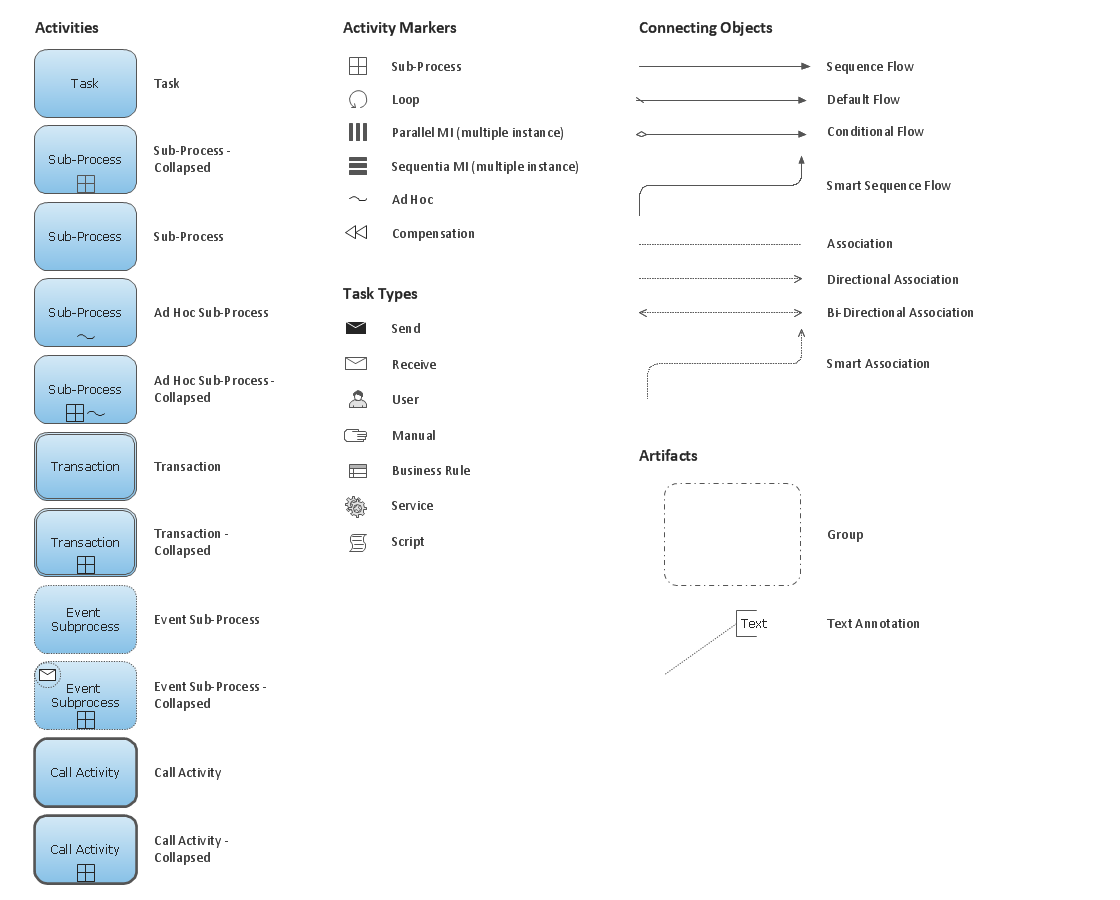
Process Flowchart


Business Process Elements: Activities

Data Flow Diagram Symbols. DFD Library

Pyramid Diagram

UML Use Case Diagram Example. Social Networking Sites Project

- ATM UML Diagrams | Draw A Transaction State Diagram
- Intraction Diagram For Bank Transaction
- State Transaction Diagram For Cab Management System
- Rapid UML | Online Shop State Transaction Diagram
- State Machine Diagram | UML Use Case Diagram Example ...
- Draw The State Chart Diagram For Atm Transaction System
- Design elements - Bank UML state machine diagram | How to ...
- State Diagram Of Atm Machine
- ATM UML Diagrams
- ATM UML Diagrams | Rapid UML | Component Diagram Online ...