Basic Flowchart Symbols and Meaning


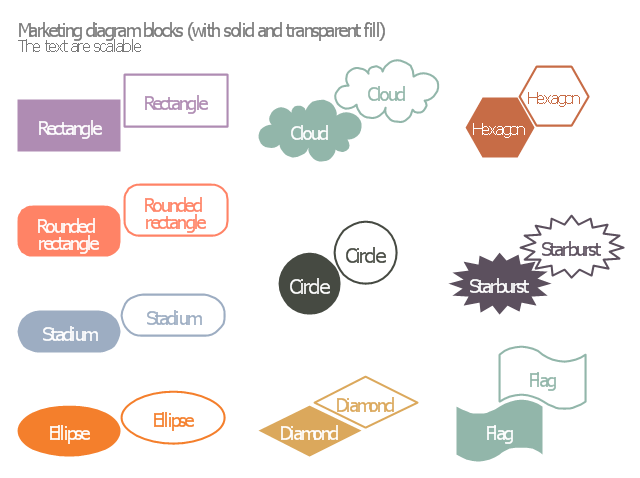
The vector stencils library "Marketing diagram" contains 20 solid and transparent geometric shapes: rectangle, rounded rectangle, ellipse, cloud, circle, diamond, hexagon, starburst, flag.
Use it to illustrate your marketing infograms with block diagrams.
"The term diagram in its commonly used sense can have a general or specific meaning:
(1) visual information device: Like the term "illustration" the diagram is used as a collective term standing for the whole class of technical genres, including graphs, technical drawings and tables.
(2) specific kind of visual display: This is the genre that shows qualitative data with shapes that are connected by lines, arrows, or other visual links. ...
In the specific sense diagrams and charts contrast with computer graphics, technical illustrations, infographics, maps, and technical drawings, by showing "abstract rather than literal representations of information". The essence of a diagram can be seen as:
(1) a form of visual formatting devices;
(2) a display that does not show quantitative data (numerical data), but rather relationships and abstract information;
(3) with building blocks such as geometrical shapes connected by lines, arrows, or other visual links." [Diagram. Wikipedia]
The shapes example "Design elements - Marketing diagram" was created using the ConceptDraw PRO diagramming and vector drawing software extended with the Marketing Infographics solition from the area "Business Infographics" in ConceptDraw Solution Park.
Diagram building blocks
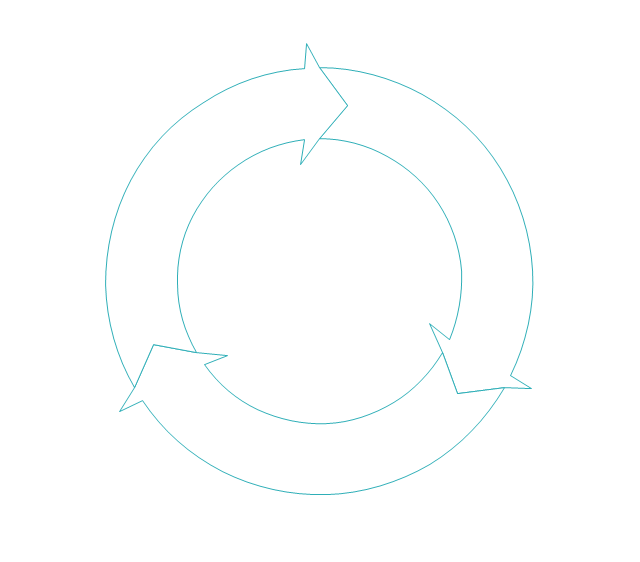
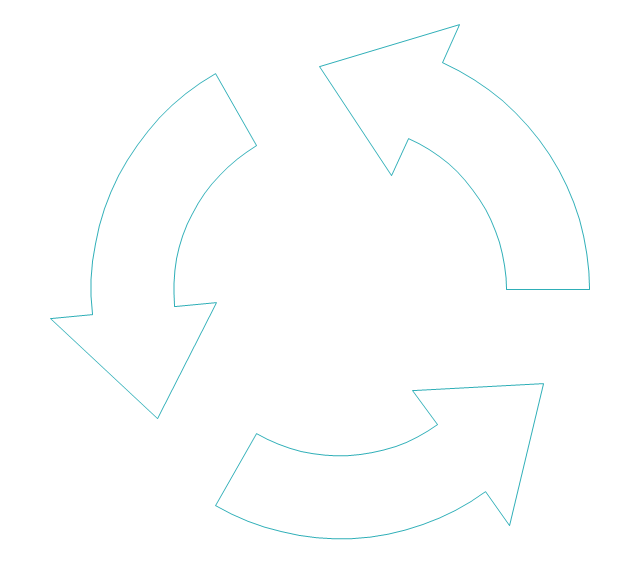
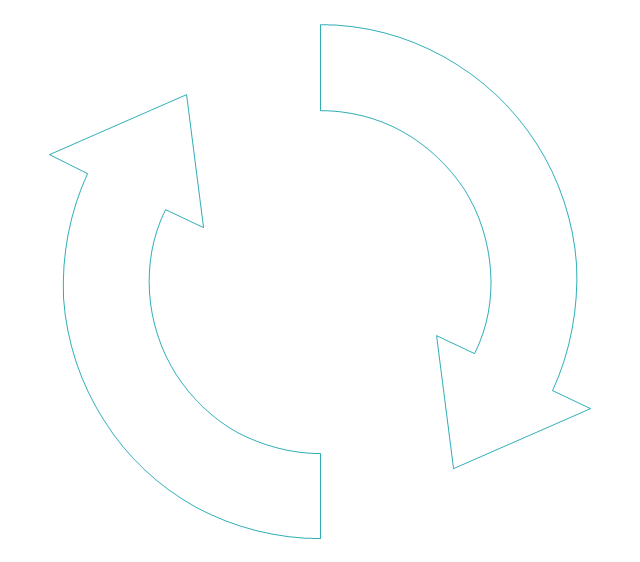
The vector stencils library "Sales arrows" contains 57 arrow symbols.
Use these arrow icon set to draw your sales flowcharts, workflow diagrams and process charts with the ConceptDraw PRO diagramming and vector drawing software.
The arrow pictograms library "Sales arrows" is included in the Sales Flowcharts solution from the Marketing area of ConceptDraw Solution Park.
Angle arrow
Arc arrow
Arki arrow
Arrow fork
Arrow loop
Bent arrow
Chevron arrow
Circular arrow
Circular motion arrows
Clockwise arrow
Corner arrow
Counterclockwise arrow
Crossed arrows

Curved left arrow
Curved right arrow
Curving directional arrow
Cycle arrow
Diagonal arrow
Double arc arrow
Double headed arrow
Double headed semicircle arrow
Down arrow
Dual short arc arrow
Elbow arrow
Fat arrow
Go back arrow
Interaction arrows

L-shaped arrow
Left arrow
Lightning arrow
Long arc arrow
Looping arrows
Merging arrows

Moving down arrow
Moving up arrow
Recycling arrows

Refresh arrows
Ribbon arrow
Right arrow
Rotating arrows
S-shaped arrow
Sector arrow
Semicircle arrow
Short arc arrow
Single headed arrow
Small arrow
Split arrow
Straight arrow
Triangle arrow
Turn left arrow
Turn right arrow
Turn round arrow
Turned arrow
Up arrow
U-shaped arrow
Vertical moving arrow
Wavy arrow
Structured Systems Analysis and Design Method (SSADM) with ConceptDraw PRO

The vector stencils library "Transport map" contains 96 pictograms for drawing transport maps.
Use it in your spatial infographics for visual representation of transport schemes and plans as metro maps in the ConceptDraw PRO diagramming and vector drawing software extended with the Spatial Infographics solution from the area "What is Infographics" of ConceptDraw Solution Park.
Use it in your spatial infographics for visual representation of transport schemes and plans as metro maps in the ConceptDraw PRO diagramming and vector drawing software extended with the Spatial Infographics solution from the area "What is Infographics" of ConceptDraw Solution Park.
Train Railway

Bus Stop

Tramlink

Marina/Ferry Dock

Information Center

Information Center

Airport

Airport

Underground/Subway/Metro

Underground/Subway/Metro

National Rail Train Station

Taxi

Taxi

Parking

Parking

Parking

Parking

Bicycle Parking

Bicycle Parking

Fuel/Gas/Petrol

Fuel/Gas/Petrol

Police

Police

Hospital

Hospital

Wheelchair Access

Wheelchair Access

First Aid

First Aid

Telephone

Telephone

Post Office

Post Office

Landmarks and Museums

Landmarks and Museums

University

University

Shopping/Supermarket

Shopping/Supermarket

Cafe

Cafe

Food and Drinks

Food and Drinks

Man

Woman

Restrooms/Toilets

Restrooms/Toilets

Park

Park

Zoo

Zoo

Hotel

Hotel

Camping

Camping

City

Skyscraper

Building

Ocean

Straight River

Flexible River

Bridge

North Arrow
Viewpoint

Scale
Road line

Road rounded line

Road corner

Road curve 1

Road curve 2

Crossroads

Roundabout
Cloverleaf interchange

Roadway break

Railway line

Railway curve
Railway fork

Standard line with standard station - basic road

Thick line with standard station - basic road

Standard line with rectangular station - basic road

Thick line with rectangular station - basic road

Standard line with standard station - double road

Thick line with standard station - double road

Standard line with rectangular station - double road

Thick line with rectangular station - double road

Standard line with standard station - dotted road

Thick line with standard station - dotted road

Standard line with rectangular station - dotted road

Thick line with rectangular station - dotted road

Interchange Station Vertical

Interchange Station Horizontal

Transfer Station 1

Transfer Station 2

Transfer Station 3

Line Notation

Street direction

UML Diagram for Mac

Modern Garden Design

The vector stencils library "Ribbon interface" contains 41 ribbon shapes.
Use it for designing Microsoft ribbon graphic user interface (GUI) of software for Windows computers in the ConceptDraw PRO diagramming and vector drawing software extended with the Graphic User Interface solution from the Software Development area of ConceptDraw Solution Park.
Use it for designing Microsoft ribbon graphic user interface (GUI) of software for Windows computers in the ConceptDraw PRO diagramming and vector drawing software extended with the Graphic User Interface solution from the Software Development area of ConceptDraw Solution Park.
Main Window with Menu
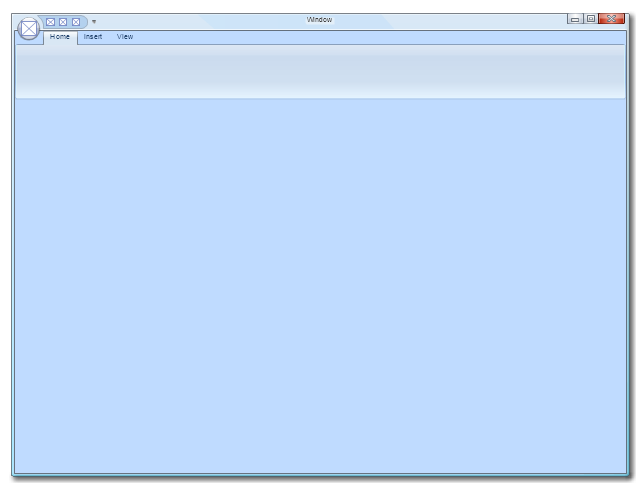
Main Window
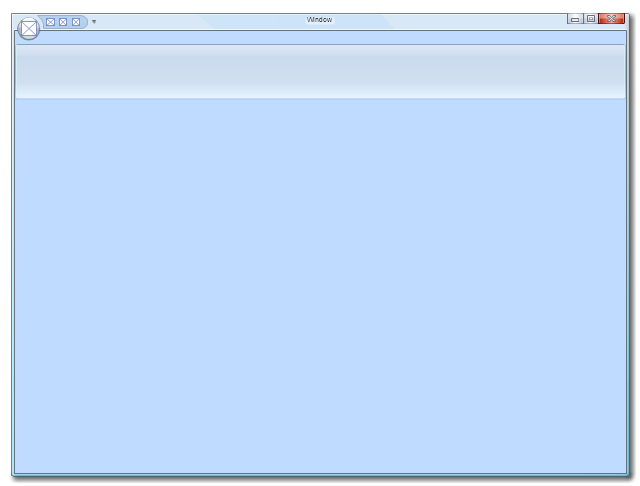
Menu

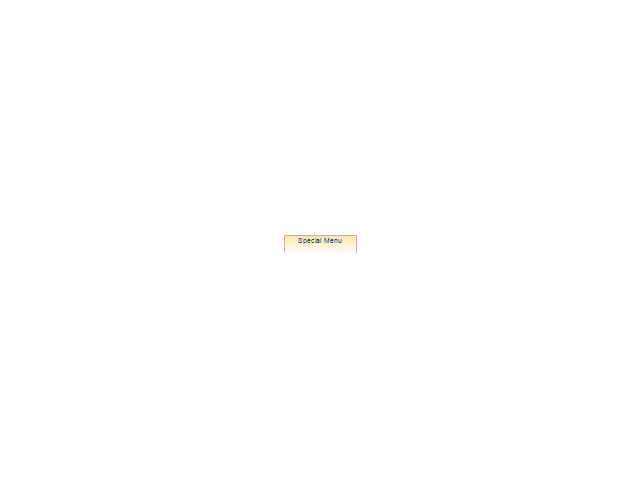
Special Menu
Field

Tools Group
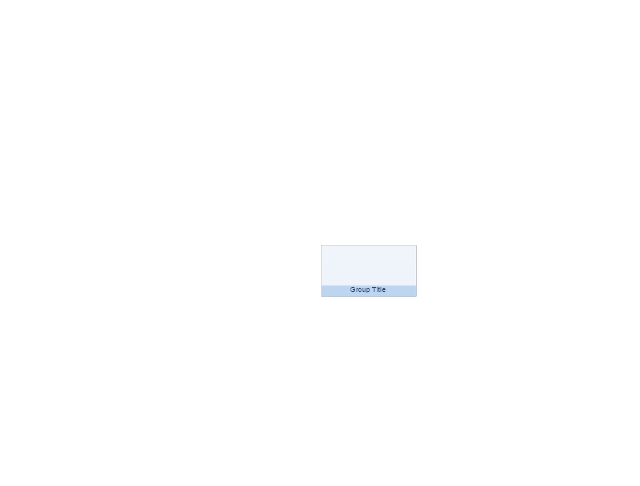
Tools Group Minimized

Tool Button

Tool Button

Toolbar

Label

Text Label

Edit Box
Combobox
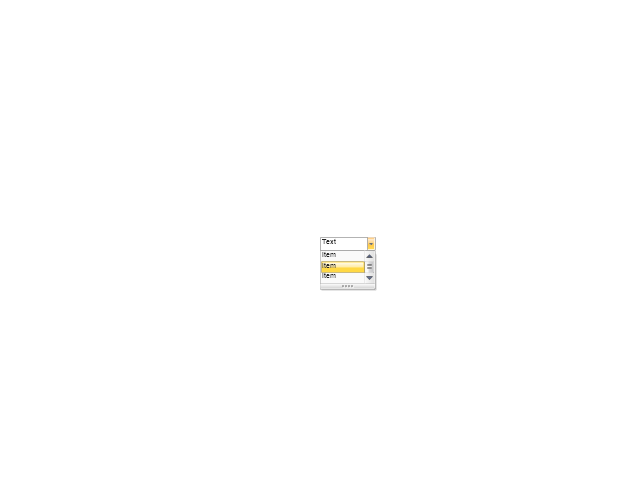
Combobox with List
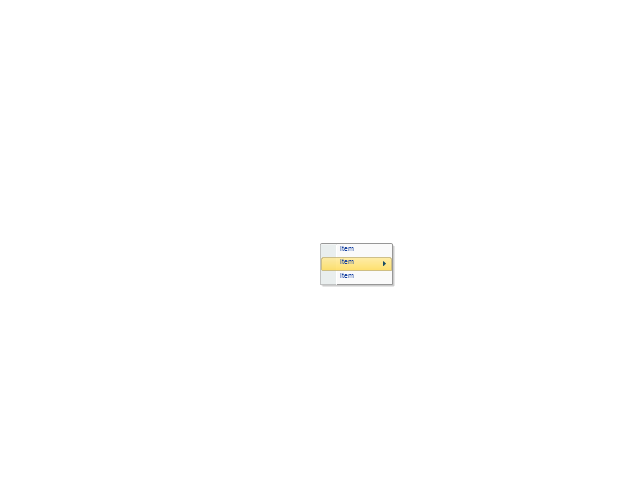
Drop-down Menu
Spin Box
Check Box

Radio Button

Styles Control 1

Styles Control 2

Rounded Tab

Floating Dialogue

Status Bar

Small Toolbar (for Status Bar)
-ribbon-interface---vector-stencils-library.png--diagram-flowchart-example.png)
Zoom Slider

Horizontal Scroll
Vertical Scroll
Drop-down List

Arrow
Close

Drop-down Menu Base

Drop-down Menu Left Part

Menu/List Item (Text)
-ribbon-interface---vector-stencils-library.png--diagram-flowchart-example.png)
Menu/List Item (Image)
-ribbon-interface---vector-stencils-library.png--diagram-flowchart-example.png)
Menu/List Item (Image with Text)
-ribbon-interface---vector-stencils-library.png--diagram-flowchart-example.png)
Meny/List Header

Drop-down Menu Separator

Vertical Separator

Chek/Option for Drop-down Menu

Image

Functional Block Diagram

How To use Landscape Design Software

- Bend Arrow Transparent Background
- Free Png Transparent Arrow
- Curved Arrow Clipart Png Transparent
- Curved Png Transparent
- Arrow Png Transparent
- Data Flow Diagrams (DFD) | Backwards Loop Arrow Png
- HR arrows - Vector stencils library | 2 Sided Curve Arrow Png
- Transparent Circle Png
- Rounded Arrows Png
- Welding - Vector stencils library | Arrows - Vector clipart library ...