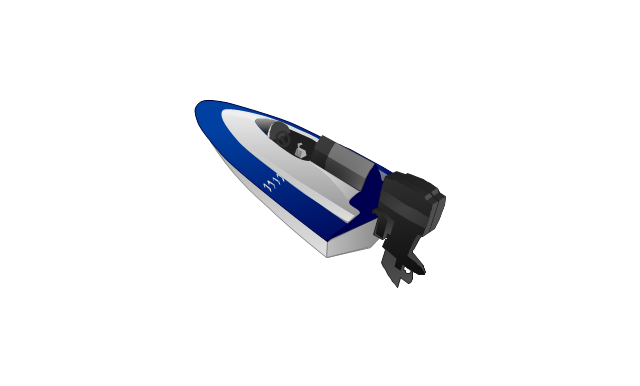
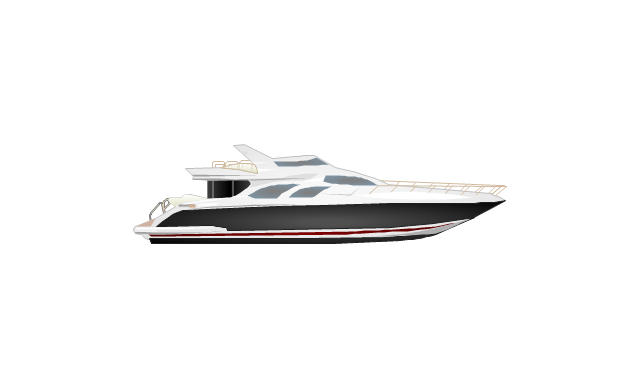
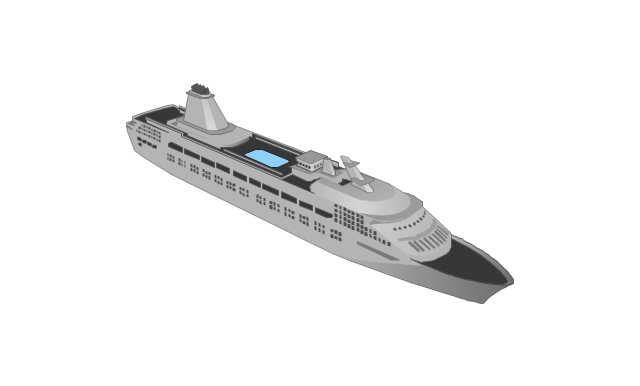
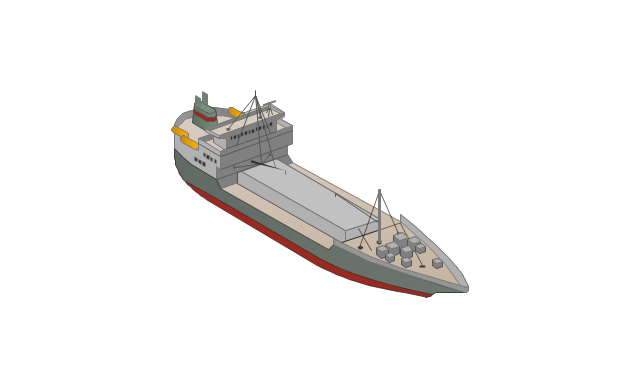
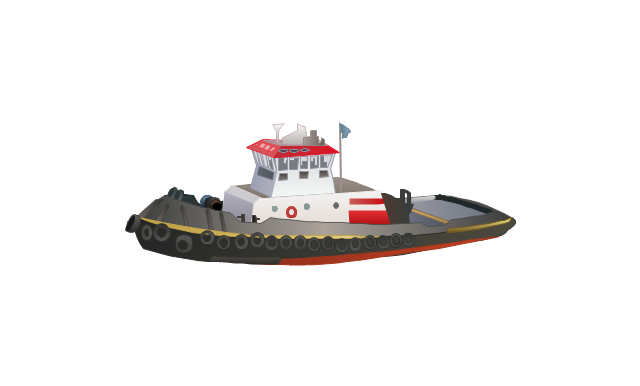
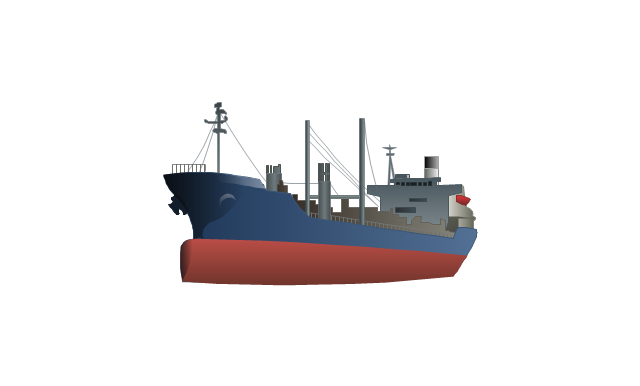
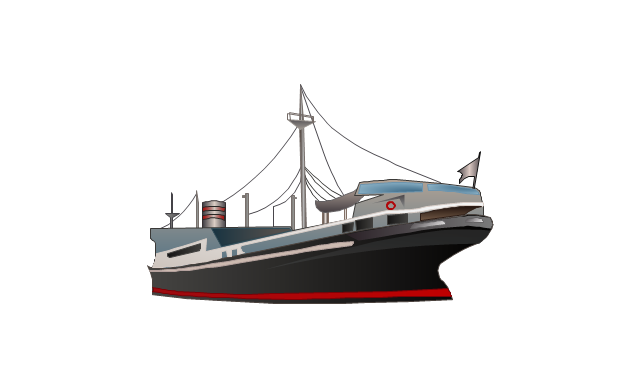
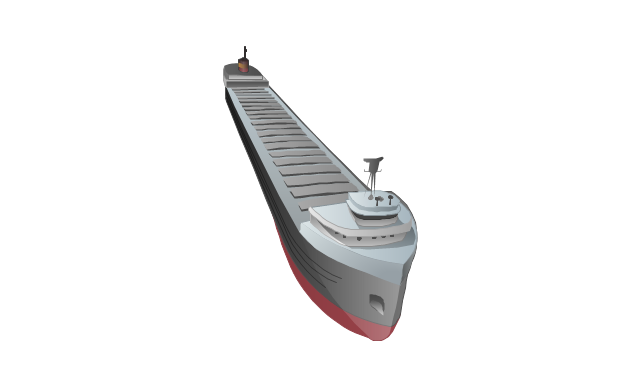
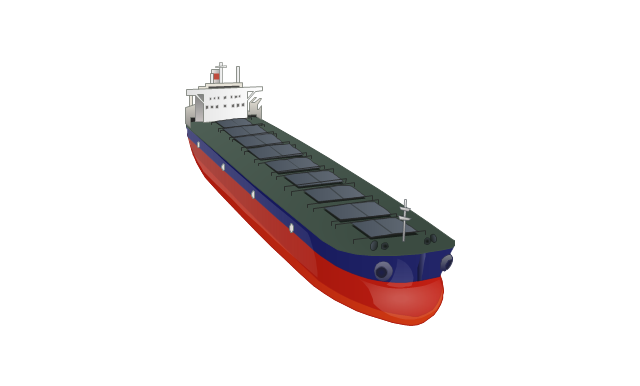
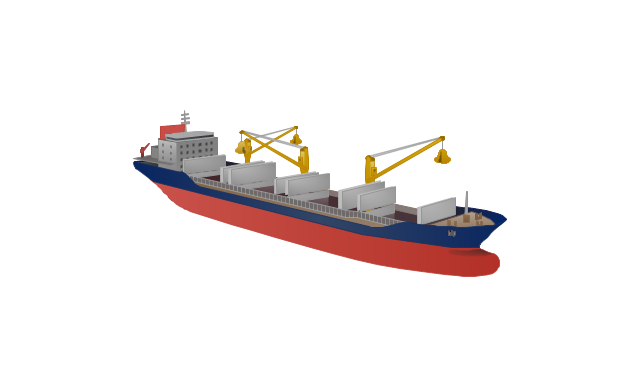
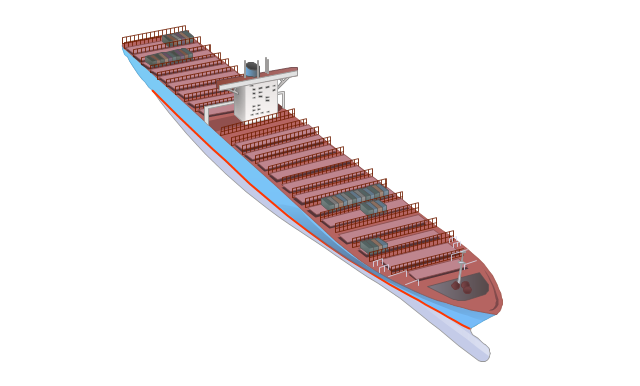
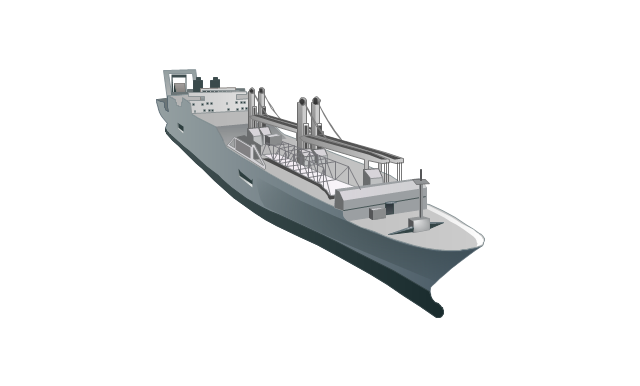
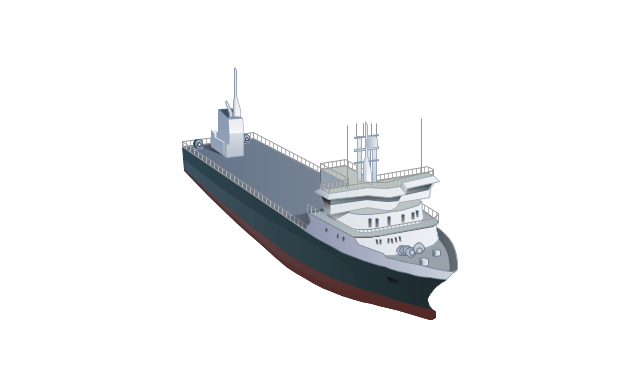
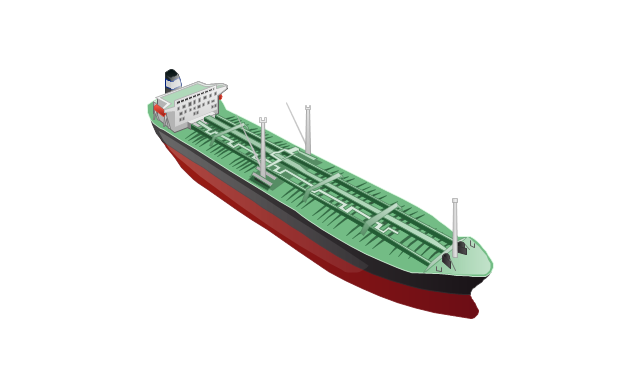
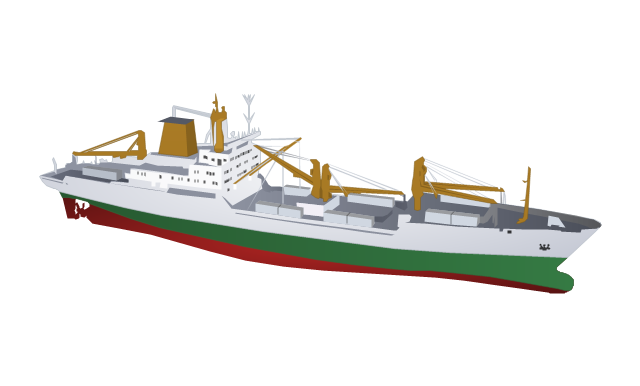
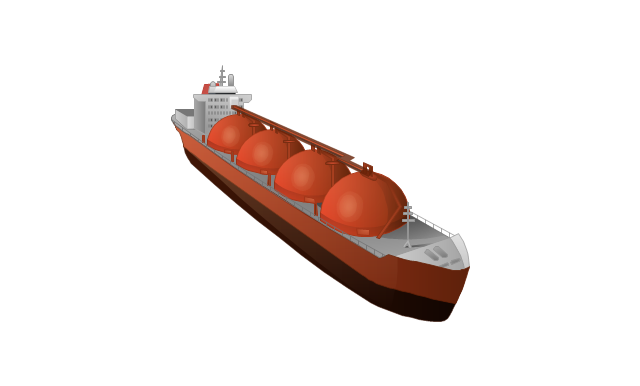
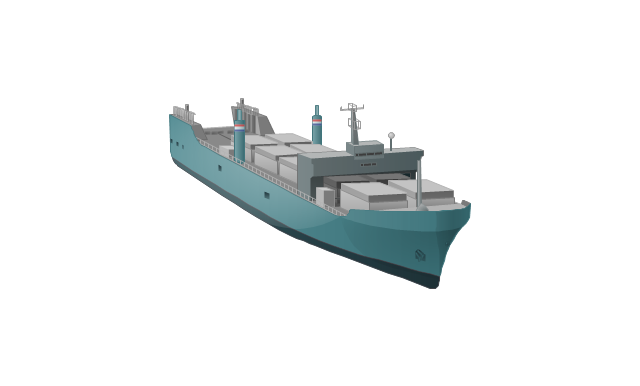
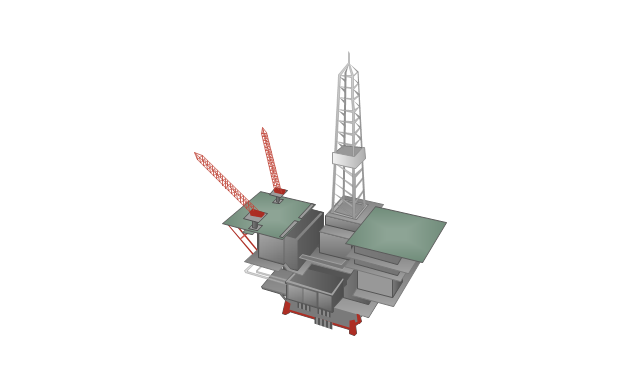
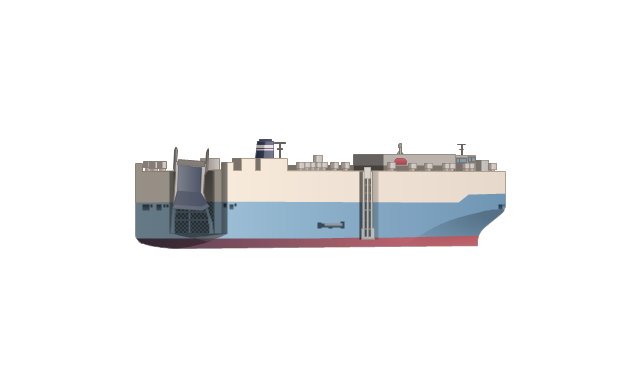
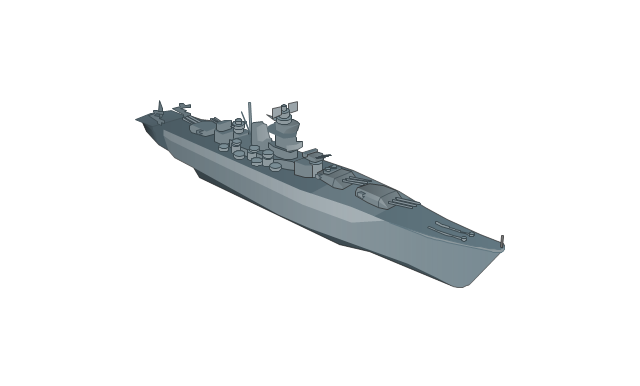
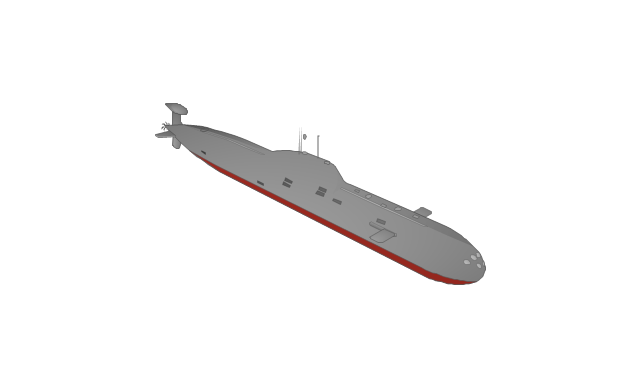
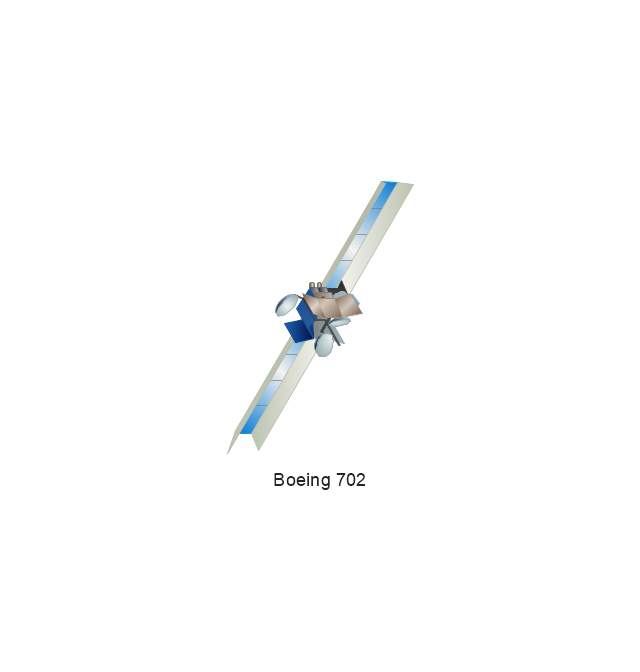
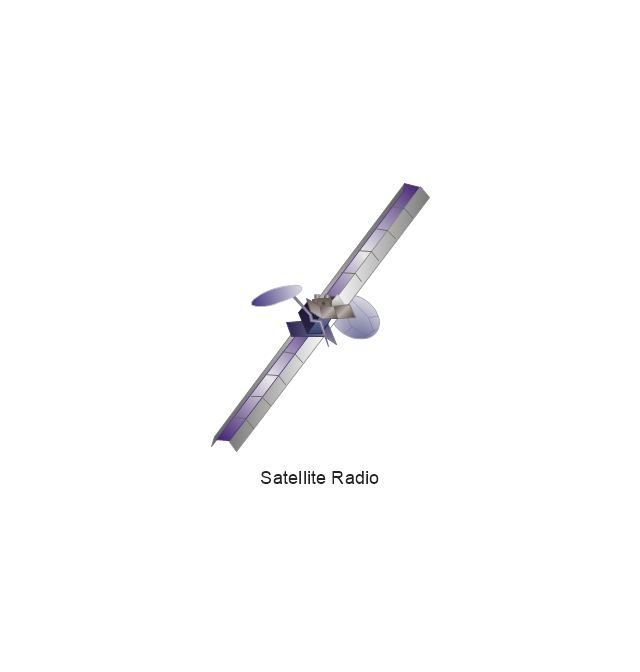
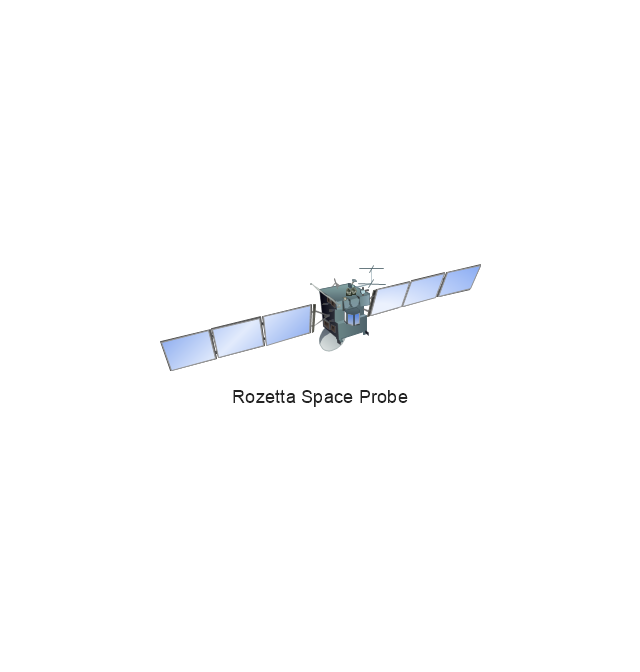
The vector stencils library "Watercraft" contains 28 clip art images for creating ship transport illustrations, presentation slides, infographics and webpages using the ConceptDraw PRO diagramming and vector drawing software.
"The term watercraft covers a range of different vehicles including ships, boats, hovercraft and submarines, and differs from a simple device that merely floats, such as a log raft. ...
Usually the purposes behind watercraft designs and skills are for seafaring education or leisure activities, fishing and resource extraction, transportation of cargo or passengers, and for conducting combat or salvage operations. In general, the purpose of a water vehicle identifies its utility with a maritime industry sub-sector." [Watercraft. Wikipedia]
The vector stencils library "Watercraft" is included in the Aerospace and Transport solution from the Illustrations area of ConceptDraw Solution Park.
www.conceptdraw.com/ solution-park/ illustrations-aerospace-transport
 Critical Infrastructure Sectors
Critical Infrastructure Sectors solution for ConceptDraw DIAGRAM software provides a set of examples and vector stencil libraries for designing infographics and diagrams about means for the most efficient protection of critical infrastructure, energy sector, and rapid recovery in the case of disruptions. Illustrate your projects on the prevention of physical, environmental, and cyber threats, development of information technology and detection equipment. Improve your projects in communications, financial services, emergency services, homeland security, cybersecurity to solve critical issues efficiently and decrease the detrimental effects of disruptions on society and citizens. Show the results of testing new technologies and newest equipment for critical infrastructure protection and increasing resilience.
 Pie Charts
Pie Charts are extensively used in statistics and business for explaining data and work results, in mass media for comparison (i.e. to visualize the percentage for the parts of one total), and in many other fields. The Pie Charts solution for ConceptDraw DIAGRAM offers powerful drawing tools, varied templates, samples, and a library of vector stencils for simple construction and design of Pie Charts, Donut Chart, and Pie Graph Worksheets.
 Public Utilities
Public Utilities solution is a thematic toolset for designing infographics and diagrams about public utilities. It provides examples and premade public utility icons in vector icons libraries to develop innovative strategies for the improvement of public utility services, enhance their efficiency of delivery, and extend reliable access to services to all communities. The solution helps to public utility companies plan their activities efficiently, develop new technologies and make visual presentation, create plumbing plan, heating plan, electrical diagram, or any other technical drawing, make the overview of modern public utilities, increase utility profits, and remain the best in the market.
 Enterprise Architecture Diagrams
Enterprise Architecture Diagrams solution extends ConceptDraw DIAGRAM software with templates, samples and library of vector stencils for drawing the diagrams of enterprise architecture models.
 Sustainable Development
The Sustainable Development solution extends ConceptDraw DIAGRAM with a set of pre-made samples and a large collection of predesigned objects, symbols, and pictograms for designing professionally looking diagrams related to sustainable development, its processes, goals, methods, and ways for their achievement. This solution is really helpful to create schematics and designs illustrating the main points of sustainable development, social sustainability, narrating about sustainable energy and sources of green energy. It is useful to develop sustainable development plans that need to be implemented to ensure the safety of nature, list the UN sustainable development goals, draw up a plan for building a smart city and implementing the principles of sustainable agriculture, and other important information.
 Internet of Things
The Internet of Things solution extends ConceptDraw DIAGRAM with a set of samples and a wide collection of predesigned special clipart, pictograms, and symbols of IoT sensors, IoT devices, smart appliances, retail, industrial, and agricultural IoT devices, and many other IoT objects. This solution is incredibly helpful for designing the Internet of Things (IoT) and Web of Things (WoT) diagrams and infographics of different complexity for numerous areas and industries. It is incredibly useful for engineers, designers, electricians, mechanics, developers, technicians, electronics, and safety-related specialists.
The vector stencils library "Sales arrows" contains 57 arrow symbols.
Use these arrow icon set to draw your sales flowcharts, workflow diagrams and process charts with the ConceptDraw PRO diagramming and vector drawing software.
The arrow pictograms library "Sales arrows" is included in the Sales Flowcharts solution from the Marketing area of ConceptDraw Solution Park.
 Economy Infographics
The Economy Infographics solution provides a large collection of vector icon libraries, drawing samples and infographic examples for quick and simple design of the best infographics, illustrations, and presentations about economics, markets, economic policy, business, finances, government and social institutions, production, distribution, and consumption of goods and services, economic diagrams and schemes, economic activities designs, continent and country economic maps, economic presentations, market economy and economic system infographic charts, illustrations in economic articles, reports in mass media, and blog posts in social media. It is a valuable tool for wide range of economists, politicians, managers, marketing experts, business analysts, journalists and bloggers focusing on economy, educators and students studying economics, and many other people to communicate visually the economic information.
 Project Management Package
Project Management Package includes a large set of graphical solutions from the ConceptDraw Solution Park. They are selected specially to help in completing the business and management goals, creating business models and modeling business processes, analyzing business progress and efficiency of projects implementation. The tools of this package's solutions are helpful to create number of diagrams and dashboards including Management Diagrams, Business diagrams, Bubble diagrams, Circle-spoke diagrams, Circular arrows diagrams, Venn diagrams, Scrum charts, Kanban boards, Business Intelligence maps, Business Metric charts, Dynamic charts, Project diagrams, Hierarchical charts, Influence diagrams, Work Breakdown Structures (WBS), Resource Breakdown Structures (RBS), PERT Diagrams, Project management charts, Project timelines, Gantt Charts, Funnel diagrams, Stakeholder Onion diagrams, and many more.
 Business Package for Management
Package intended for professional who designing and documenting business processes, preparing business reports, plan projects and manage projects, manage organizational changes, prepare operational instructions, supervising specific department of an organization, workout customer service processes and prepare trainings for customer service personal, carry out a variety of duties to organize business workflow.
 Business Diagrams Package
Business Diagrams Package is a large set of comprehensive graphical solutions from the ConceptDraw Solution Park, which are powerful in solving the business, marketing and quality tasks in completely different fields, such as finance, education, health food and cooking, HR, and many others. The tools of this package's solutions are a powerful assistant in drawing all diversity of Financial and Marketing infographics, Business process workflow diagrams, Organizational charts, Education infographics, Quality diagrams, Health food diagrams, HR flowcharts, as well as different graphics and charts, which depict the values of key business indicators, their dependencies, give the full understanding of a situation within a company and on the market.
 Divided Bar Diagrams
Divided Bar Diagrams Solution extends the capabilities of ConceptDraw DIAGRAM with templates, samples, and a library of vector stencils for drawing high impact and professional Divided Bar Diagrams and Graphs, Bar Diagram Math, and Stacked Graph. Divided Bar Diagram library objects include a legend that describes categories and can be shown or hidden, moved into a diagram; some objects also include a table of input values for categories. Enter your data in the table, and the segments will be displayed on the chart in accordance with the table data; when you make changes, the chart changes automatically.
 Stakeholder Onion Diagrams
The Stakeholder Onion Diagrams solution supplies ConceptDraw DIAGRAM with powerful tools to simplify the process of creating Stakeholder Onion Diagrams. It includes the set of pre-made vector objects and templates for a quick start, and collection of examples illustrating the solution's power. This solution is useful for all specialists in management and business, especially for those who prefer to use the newest progressive tools.
 Basic Circular Arrows Diagrams
Basic Circular Arrows Diagrams solution extends ConceptDraw DIAGRAM with predesigned samples and a library of vector stencils allowing one to create the Circular Arrows diagrams for any purpose or need. Start with one desired of ready-made vector stencils or samples, use it as a circular flow diagram template and make the Circular Arrow Diagram with the required quantity of sectors in a few minutes. Finally, customize your diagram, make stylish changes using the contrasting colors for different steps or identical for some of them, to highlight the most important steps, so designing a diagram the best fitting your taste.
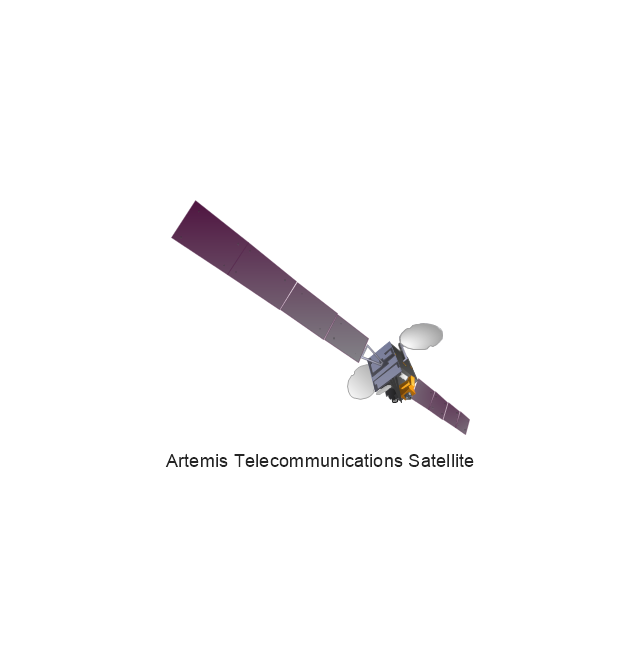
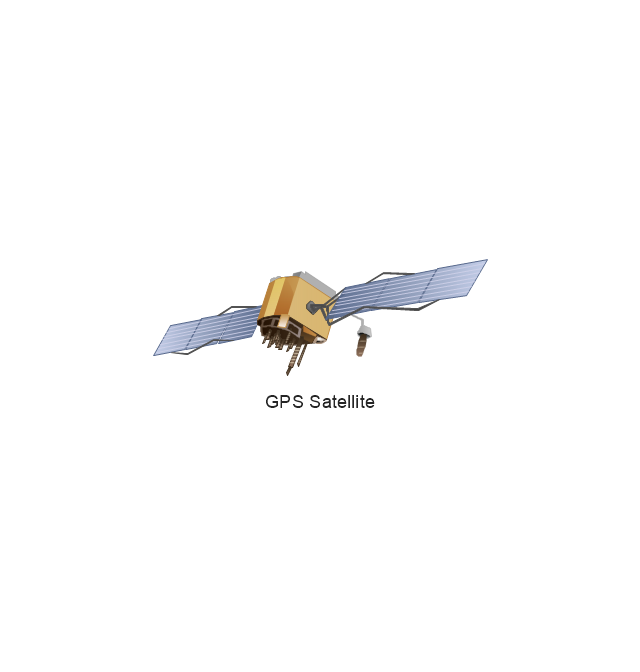
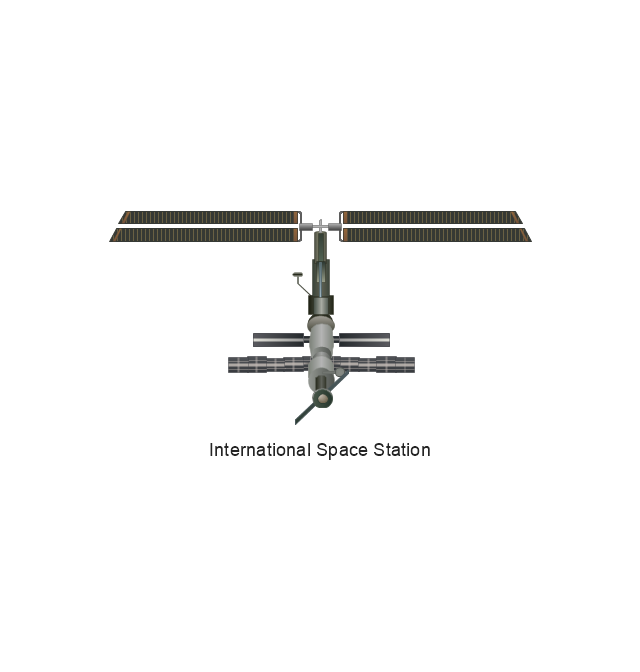
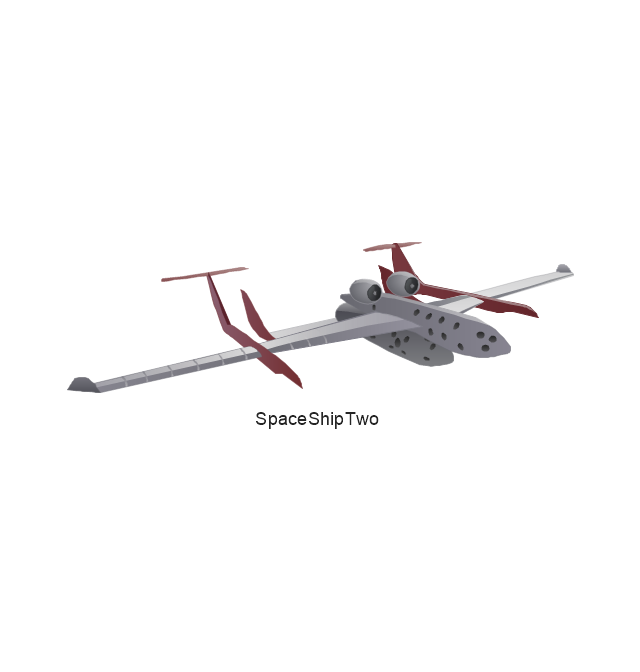
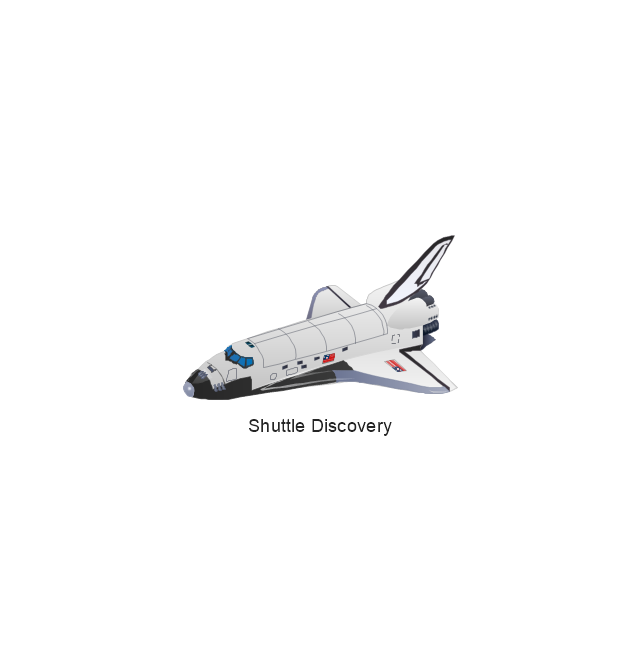
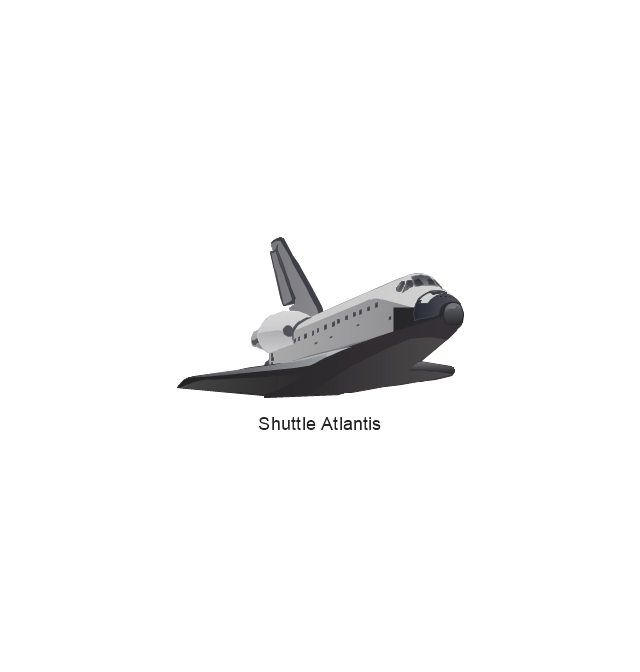
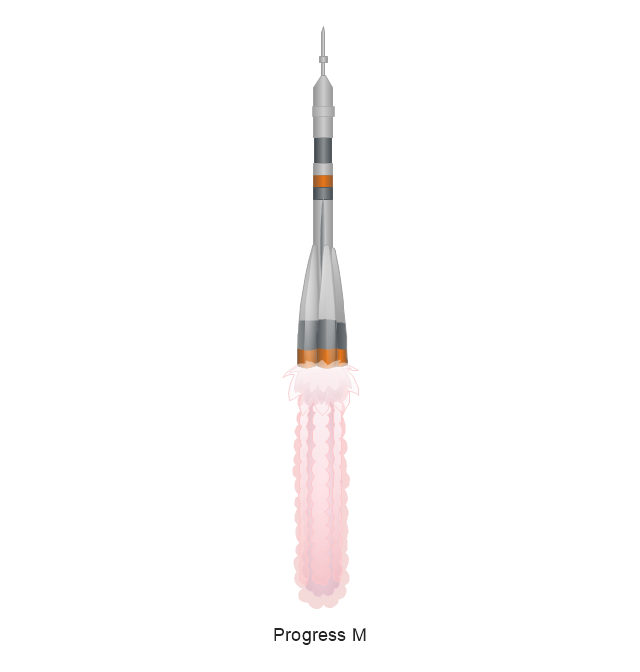
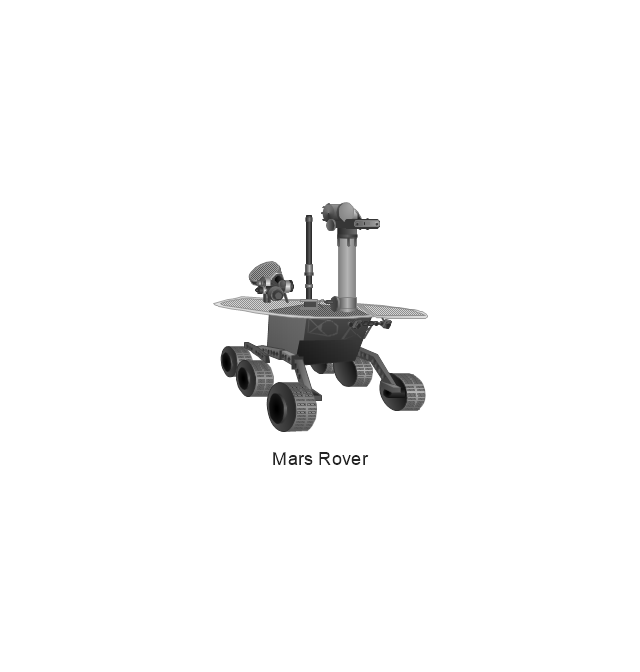
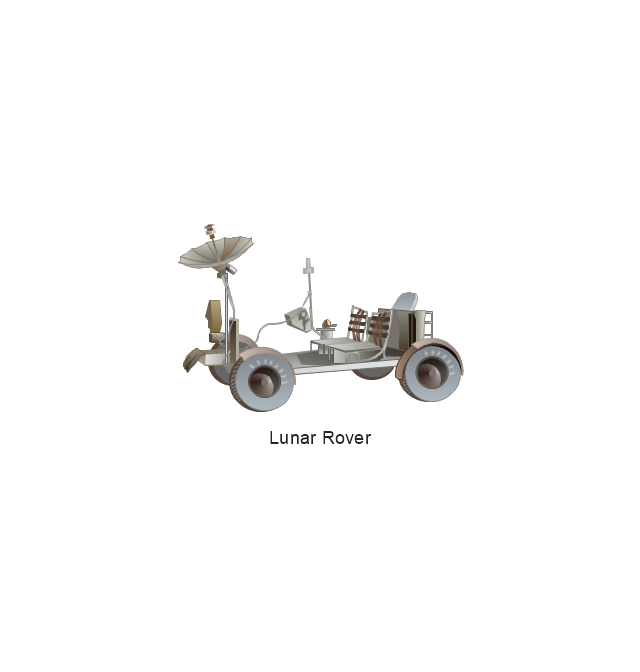
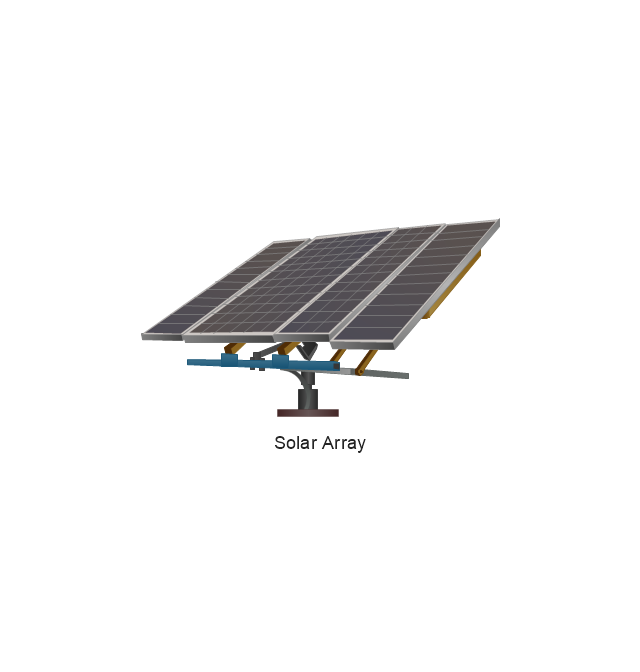
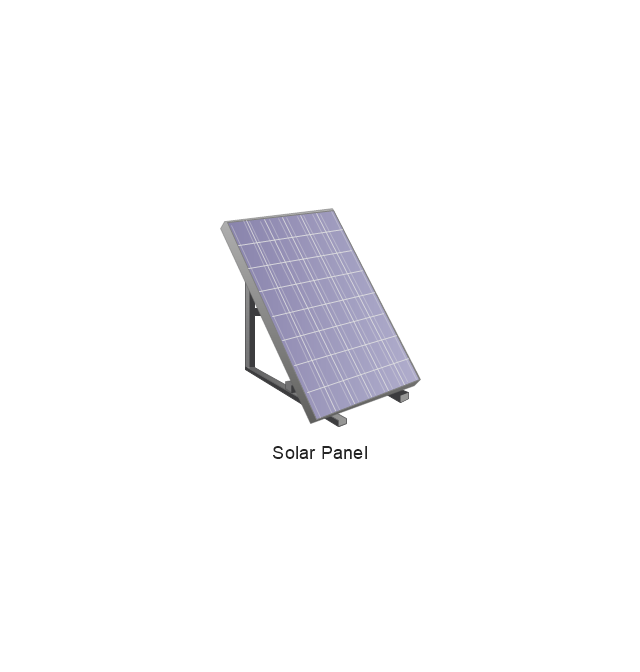
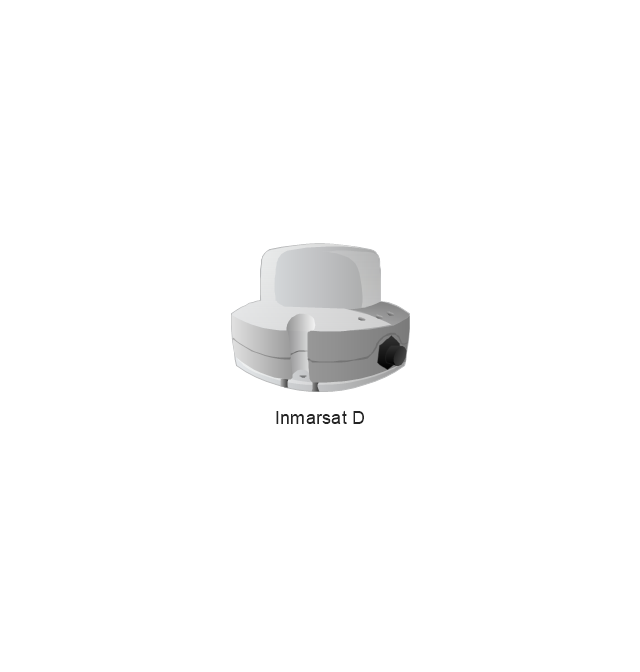
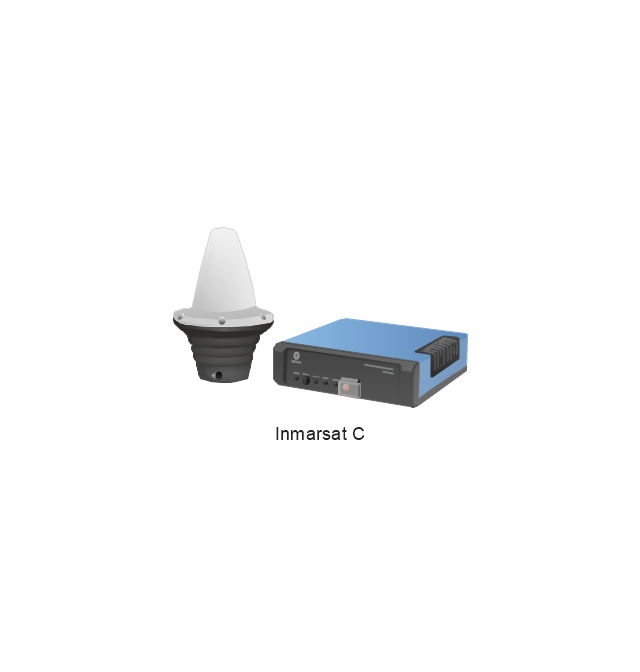
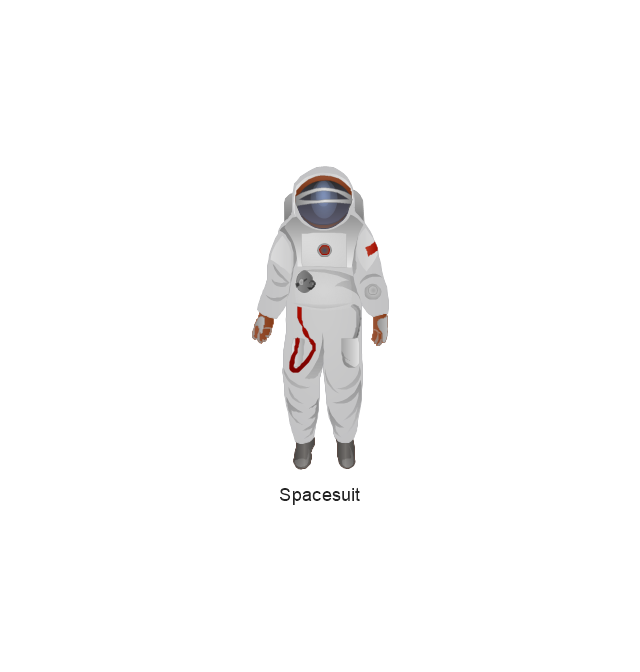
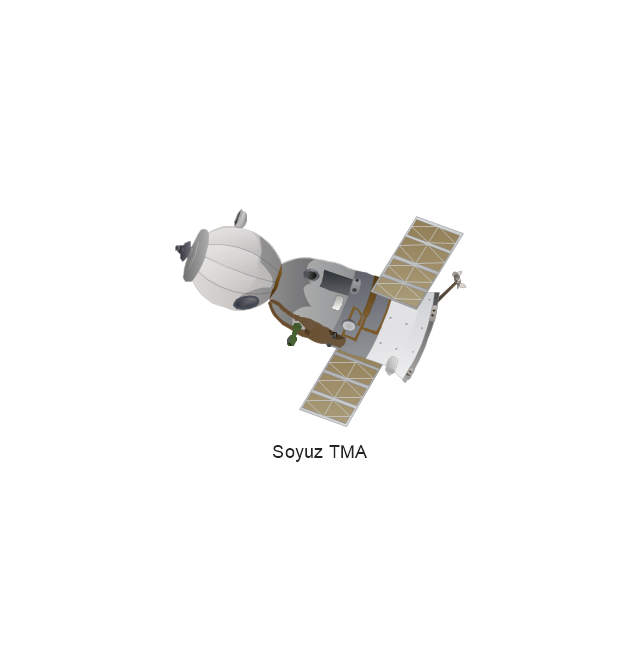
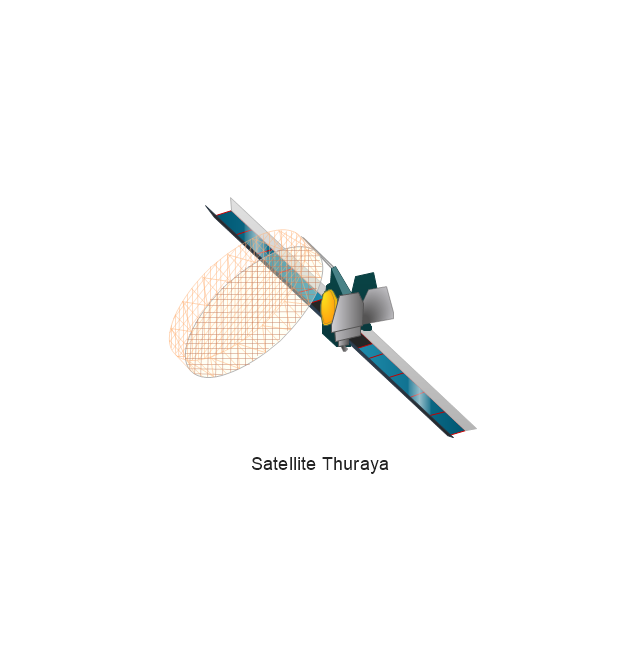
The vector stencils library "Aerospace" contains 38 clip art images for creating aerospace illustrations, presentation slides, infographics and webpages using the ConceptDraw PRO diagramming and vector drawing software.
"Aerospace describes the human effort in science, engineering and business to fly in the atmosphere of Earth (aeronautics) and surrounding space (astronautics). Aerospace organisations research, design, manufacture, operate, or maintain aircraft and/ or spacecraft. Aerospace activity is very diverse, with a multitude of commercial, industrial and military applications.
Aerospace is not the same as airspace, which is the physical air space directly above a location on the ground." [Aerospace. Wikipedia]
The vector stencils library "Aerospace" is included in the Aerospace and Transport solution from the Illustrations area of ConceptDraw Solution Park.
www.conceptdraw.com/ solution-park/ illustrations-aerospace-transport
Pie Chart Examples and Templates
A pie chart or a circle graph is a circular chart divided into sectors, illustrating numerical proportion. In a pie chart, the arc length of each sector and consequently its central angle and area, is proportional to the quantity it represents. Pie chart examples and templates created using ConceptDraw DIAGRAM software helps you get closer with pie charts and find pie chart examples suite your needs.Piping and Instrumentation Diagram Software
Piping and Instrumentation Diagram is a technical sketch or drawing, which shows in details the piping system and instrumentation of a processing plant. Piping and Instrumentation Diagram is developed by process design engineers and technical engineers on the phase of plant design. This plan is necessary on the stages of plant construction and then is actively used by operators, instrumentation and piping engineers when operating the plant. ConceptDraw DIAGRAM software provides unique Plumbing and Piping Plans solution from Building Plans area of ConceptDraw Solution Park with 10 libraries of ready-to-use predesigned vector elements, templates and samples, to help you create professional Piping diagrams and schematics, Instrumentation diagrams, Plumbing plans and blueprints, Schemes of hot and cold water supply systems, Heating schemes, Mechanical diagrams, Diagrams of fluids, hydraulics, air and gas pipings, Technical drawings of waste water disposal systems, Schematics of industrial piping systems, Diagrams of ventilation systems, etc.
 Energy Industry Infographics
Energy Industry Infographics solution is ideal for designing energy-related business infographics, diagrams, charts, illustrations for documents and presentations. It provides a set of libraries with special vector energy industry symbols, icons for electrical power industry, nuclear power industry, fossil fuel industry, and renewable energy industry, energy icons of fuel gas, liquid fuel, solid fuel, industry icons of electrical substations, power plants. Collection of samples including nuclear fuel cycle and energy distribution schematics, electrical substation diagram, energy intelligence dashboard, electricity grid schematics, and many more is also included. This solution is indispensable for all engineers, chefs, managers, marketers, and other professionals working in energy industry.
- Design elements - Watercraft | Road transport - Vector stencils ...
- Watercraft - Vector stencils library | Aerospace and Transport
- Design elements - Watercraft | Transport - Template | Watercraft ...
- Design elements - Watercraft | Business - Design Elements ...
- Aerospace and Transport | Watercraft - Vector stencils library ...
- Watercraft - Vector stencils library | Aerospace and Transport | Small ...
- Watercraft - Vector stencils library | Aerospace and Transport ...
- Watercraft - Vector stencils library | Aerospace and Transport | Cargo ...
- Aerospace and Transport | Watercraft - Vector stencils library ...
- Watercraft - Vector stencils library | Funny transport - Vector stencils ...
