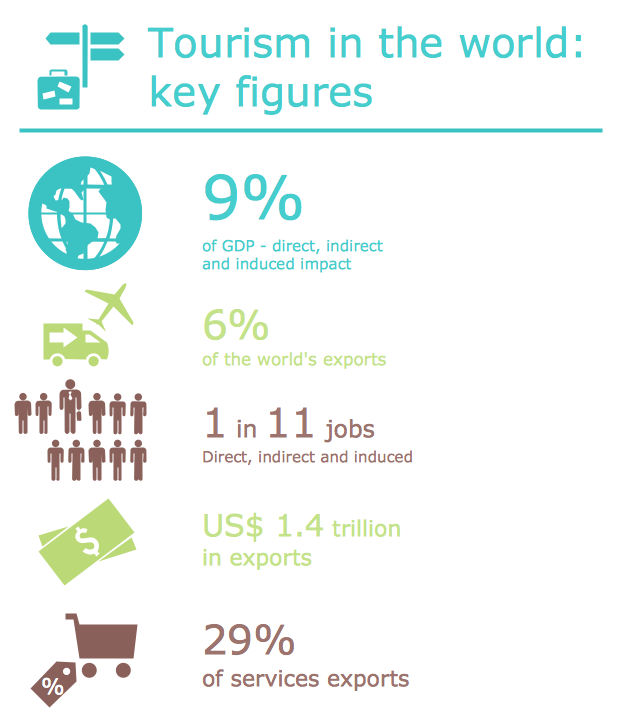
The vector stencils library "Travel and tourism pictograms" contains 20 travelling and journey symbols.
Use it to draw your tour and trip infograms. The example "Travel and tourism pictograms - Vector stencils library" was created using the ConceptDraw PRO diagramming and vector drawing software extended with the Pictorial infographics solution from the area "What is infographics" in ConceptDraw Solution Park.
Use it to draw your tour and trip infograms. The example "Travel and tourism pictograms - Vector stencils library" was created using the ConceptDraw PRO diagramming and vector drawing software extended with the Pictorial infographics solution from the area "What is infographics" in ConceptDraw Solution Park.
This vector stencils library contains 195 cloud computing icons.
Use it to design cloud computing infographic and diagrams with ConceptDraw PRO software.
"Cloud computing, also on-demand computing, is a kind of Internet-based computing that provides shared processing resources and data to computers and other devices on demand. It is a model for enabling ubiquitous, on-demand access to a shared pool of configurable computing resources (e.g., networks, servers, storage, applications and services), which can be rapidly provisioned and released with minimal management effort. Cloud computing and storage solutions provide users and enterprises with various capabilities to store and process their data in third-party data centers.
Cloud computing has become a highly demanded service or utility due to the advantages of high computing power, cheap cost of services, high performance, scalability, accessibility as well as availability." [Cloud computing. Wikipedia]
The vector stencils library "Cloud clipart" is included in the Cloud Computing Diagrams solution from the Computer and Networks area of ConceptDraw Solution Park.
The vector stencils library "Travel and tourism pictograms" contains 20 travelling and journey symbols.
Use it to draw your tour and trip infograms. The example "Travel and tourism pictograms - Vector stencils library" was created using the ConceptDraw PRO diagramming and vector drawing software extended with the Pictorial infographics solution from the area "What is infographics" in ConceptDraw Solution Park.
Use it to draw your tour and trip infograms. The example "Travel and tourism pictograms - Vector stencils library" was created using the ConceptDraw PRO diagramming and vector drawing software extended with the Pictorial infographics solution from the area "What is infographics" in ConceptDraw Solution Park.
The vector stencils library "Project management" contains 30 project management icons.
Use it to design your business and finance illustrations and infographics with ConceptDraw PRO diagramming and vector drawing software.
"Project management is the discipline of initiating, planning, executing, controlling, and closing the work of a team to achieve specific goals and meet specific success criteria. A project is a temporary endeavor designed to produce a unique product, service or result with a defined beginning and end (usually time-constrained, and often constrained by funding or deliverables) undertaken to meet unique goals and objectives, typically to bring about beneficial change or added value." [Project management. Wikipedia]
The icon set example "Design elements - Project management" is included in the Business and Finance solution from Illustration area of ConceptDraw Solution Park.
 Travel Infographics
Travel Infographics solution greatly extends the ConceptDraw DIAGRAM functionality making it the best travel infographics design software. Being intended for all specialists in the travel sphere, travel agents, marketers, advertisers, PR specialists, travelers and all other people related with tourism and rest, it contains professionally-designed samples, travel infographics template, and libraries with large variety of ready-made travel infographic vector clipart, design objects and travel infographics icons for drawing exceptional travel infographics and business travel infographics, travel illustrations, presentations, diagrams, schematics, plans, maps, posters, billboards, advertising, marketing, and other materials on the subject of travel and tourism, outdoor activities and extreme sports.
 Summer Sports
ConceptDraw DIAGRAM, complemented by the highly functional Summer Sports solution, is an effective way to create summer sports infographics, illustrations, and diagrams. This solution contains a huge collection of pre-designed vector objects for sports clipart of various types and directions, and various sports icons — cycling vector sport icon, gymnastics vector icons, water sport vector icons, equestrian vector icons, extreme sports vector icons, and many others. Many pictorial summer sports samples are also included. Use the Summer Sports solution tools to develop visual materials for presentations and conferences, summer sports posters, illustrations for travel programs, clothing and item designs with sports icons, and promotional materials to attract visitors to sports and other sport events.
 ConceptDraw Solution Park
ConceptDraw Solution Park collects graphic extensions, examples and learning materials
The vector stencils library "Project management" contains 30 project management icons.
Use it to design your business and finance illustrations and infographics with ConceptDraw PRO diagramming and vector drawing software.
The vector stencils library "Project management" is included in the Business and Finance solution from the Illustration area of ConceptDraw Solution Park.
Use it to design your business and finance illustrations and infographics with ConceptDraw PRO diagramming and vector drawing software.
The vector stencils library "Project management" is included in the Business and Finance solution from the Illustration area of ConceptDraw Solution Park.
The vector stencils library "Travel and tourism pictograms" contains 20 travel and tourism pictograms.
Use it to create your infographics, illustrations and presentations.
The pictogram example "Design elements - Travel and tourism pictograms" was created using the ConceptDraw PRO diagramming and vector drawing software extended with the Pictorial infographics solution from the area "What is infographics" in ConceptDraw Solution Park.
Basic of Flowchart: Meaning and Symbols
Flowcharts are the best for visually representation the business processes and the flow of a custom-order process through various departments within an organization. ConceptDraw DIAGRAM diagramming and vector drawing software extended with Flowcharts solution offers the full set of predesigned basic flowchart symbols which are gathered at two libraries: Flowchart and Flowcharts Rapid Draw. Among them are: process, terminator, decision, data, document, display, manual loop, and many other specific symbols. The meaning for each symbol offered by ConceptDraw gives the presentation about their proposed use in professional Flowcharts for business and technical processes, software algorithms, well-developed structures of web sites, Workflow diagrams, Process flow diagram and correlation in developing on-line instructional projects or business process system. Use of ready flow chart symbols in diagrams is incredibly useful — you need simply drag desired from the libraries to your document and arrange them in required order. There are a few serious alternatives to Visio for Mac, one of them is ConceptDraw DIAGRAM. It is one of the main contender with the most similar features and capabilities.
Design Pictorial Infographics. Design Infographics
In the course of recent decades data visualization went through significant development and has become an indispensable tool of journalism, business intelligence and science. The way visual information may be conveyed is not limited simply to static or dynamic representation, it can also be interactive. Infographics can be conditionally divided into several general levels. Primarily, this is level of visualization of information, its interpretation and association on any ground. Second level can be defined as a visualization of knowledge, depiction of thoughts and ideas in the form of images or diagrams. Finally, the level of data visualization, which processes data arrays in charts, enabling the information to be more clearly perceived. You can also identify the main approaches to the creation of infographics: exploratory and narrative. Exploratory method insists on minimalist design in favor of data precision without unnecessary details and is common for scientific researches and ana
 Business Package for Management
Package intended for professional who designing and documenting business processes, preparing business reports, plan projects and manage projects, manage organizational changes, prepare operational instructions, supervising specific department of an organization, workout customer service processes and prepare trainings for customer service personal, carry out a variety of duties to organize business workflow.
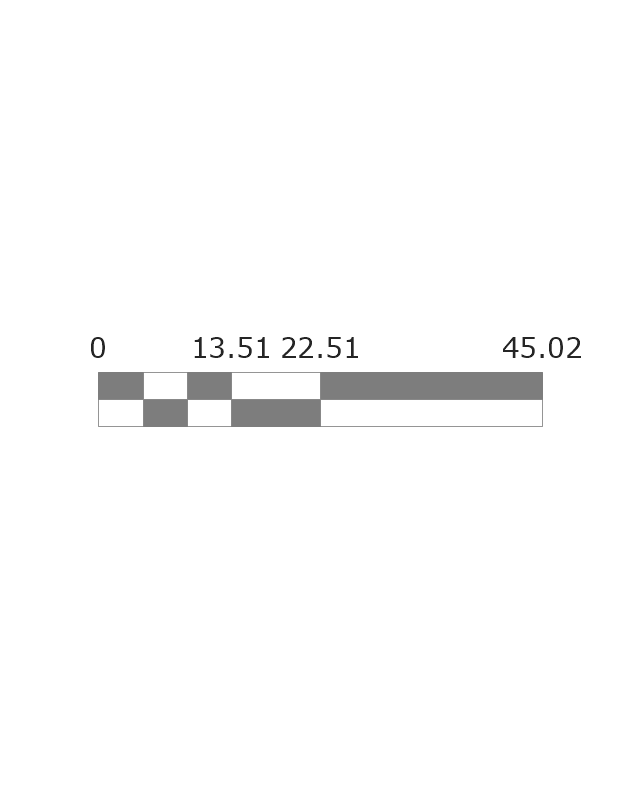
The vector stencils library "Landmarks" contains 69 landmark symbols of buildings, waterways, scale and directional indicators for labeling transportation and directional maps, road and route maps, street and transit maps, locator and tourist maps.
The pictograms example "Landmarks - Vector stencils library" was created using the ConceptDraw PRO diagramming and vector drawing software extended with the Directional Maps solution from the Maps area of ConceptDraw Solution Park.
The pictograms example "Landmarks - Vector stencils library" was created using the ConceptDraw PRO diagramming and vector drawing software extended with the Directional Maps solution from the Maps area of ConceptDraw Solution Park.
 Customer Journey Mapping
Customer Journey Mapping Solution for ConceptDraw DIAGRAM opens incredibly broad opportunities for marketing and business specialists, product managers, designers, engineers, and other people interested in business development, increasing the product’s audience, its success and users' demand, providing them with capabilities of customer journey mapping. The included diagramming and customer journey mapping tools, predesigned vector customer journey mapping icons and charts, consumer journey mapping connectors, user journey and customer mapping figures, customer experience map icons and touchpoint icons, quick-start templates and samples provide excellent conditions for the customer journey mapping process, for creating Customer Journey Map and Customer Experience Map.
 Business Process Workflow Diagrams
The Business Process Workflow Diagrams solution was developed for a purpose of extending the ConceptDraw DIAGRAM software with the pre-made examples and templates of the workflow diagrams, and a library full of vector stencils, workflow chart elements, icons, arrows, connectors for making the needed drawings at an ease. Representing the documents, transferring data and tasks during the performance of the work process has become much simpler for many specialists. The list includes university professors, PhDs, postgraduates, postdocs, scientists, researchers, IT specialists, computer engineers, network and telecommunication engineers, software engineers, technical writers, system administrators, technical support specialists, IT managers, system architects and many other professions.
 Public Utilities
Public Utilities solution is a thematic toolset for designing infographics and diagrams about public utilities. It provides examples and premade public utility icons in vector icons libraries to develop innovative strategies for the improvement of public utility services, enhance their efficiency of delivery, and extend reliable access to services to all communities. The solution helps to public utility companies plan their activities efficiently, develop new technologies and make visual presentation, create plumbing plan, heating plan, electrical diagram, or any other technical drawing, make the overview of modern public utilities, increase utility profits, and remain the best in the market.
 Health Sciences
Health Sciences solution including professionally designed samples and wide range of high-quality vector icons and pictograms of basic medical sciences, surgery specializations, internal medicine, medical diagnostics, interdisciplinary fields, mental health, obstetrics and gynecology, public health, allied health, and other medical specialties, is a perfect assistant in drawing Health diagrams, schematics, illustrations, infographics and slides for presentations on the healthcare, medical and health sciences thematic, in development knowledge in health science, in studying and representing the physical, mental and social aspects of human health, in determining the role of different health sciences at this process, finding and explaining new methods of treatment different diseases, making an overview and describing the main characteristics of health sciences in a visual form.
 Mathematics
Mathematics is simply essential in many fields, such as natural science, medicine, finance, the social sciences, and engineering. Mathematicians often face the need for creating the mathematical drawings in order to explain different theories and equations. In order to make such illustrations, the ConceptDraw DIAGRAM diagramming and drawing software may be used. The Mathematics solution can be used while working in the ConceptDraw DIAGRAM application using its pre-made samples, templates, and vector shape libraries of both solid and plane geometric figures, trigonometrical functions and mathematical symbols. It may help many mathematicians to create numeral mathematical diagrams, mathematic illustrations and tape diagrams for either scientific or educational, or both purposes.
HelpDesk
How to Create a Map of Germany
Geographical thematic maps are used to display information on a variety of subjects. It is a common way of representing any form of spatial data in relation to a specific geographical area. The Germany Map Solution for ConceptDraw DIAGRAM includes all of the German federal states with county outlined borders and major cities. You can quickly create geographic maps, cartograms, and thematic maps for geographical visualization information for business and travels.- Travel and tourism pictograms - Vector stencils library | Travel and ...
- Travel and tourism pictograms | Ticket Vector Png
- Icon Prepare A Travel Ticket Png
- IVR services - Vector stencils library | Flight Ticket Logo
- Design elements - Travel and tourism pictograms | Flight Ticket Design
- Travel and tourism pictograms | IVR services | Flight Tickets Logo Png
- Travel and tourism pictograms - Vector stencils library | Travel and ...
- Travel and tourism pictograms - Vector stencils library | Entity ...
- Travel and tourism pictograms - Vector stencils library | Travel and ...
- How To use House Electrical Plan Software | Plane Drawing Logo Png















-cloud-clipart---vector-stencils-library.png--diagram-flowchart-example.png)
-cloud-clipart---vector-stencils-library.png--diagram-flowchart-example.png)


-cloud-clipart---vector-stencils-library.png--diagram-flowchart-example.png)


-cloud-clipart---vector-stencils-library.png--diagram-flowchart-example.png)
-cloud-clipart---vector-stencils-library.png--diagram-flowchart-example.png)


