 Venn Diagrams
Venn Diagrams are actively used to illustrate simple set relationships in set theory and probability theory, logic and statistics, mathematics and computer science, linguistics, sociology, and marketing. Venn Diagrams are also often used to visually summarize the status and future viability of a project.
 Language Learning
Language Learning solution extends ConceptDraw PRO software with templates, samples and library of vector stencils for drawing the sentence diagrams.
How to Help Customers be More Productive
Presenting you with a drawing program which could really surprise you with their great functionality. Don't know how to start to draw Connector's improvement? Curious how should diagramming software work? Drawing programs involve a lot of things like designs in an illustrative way, creating an cherts, Tools to create high end graphics, create dashboards, using your data and many other technical aspects do it in a much professional and in a quick way.HelpDesk
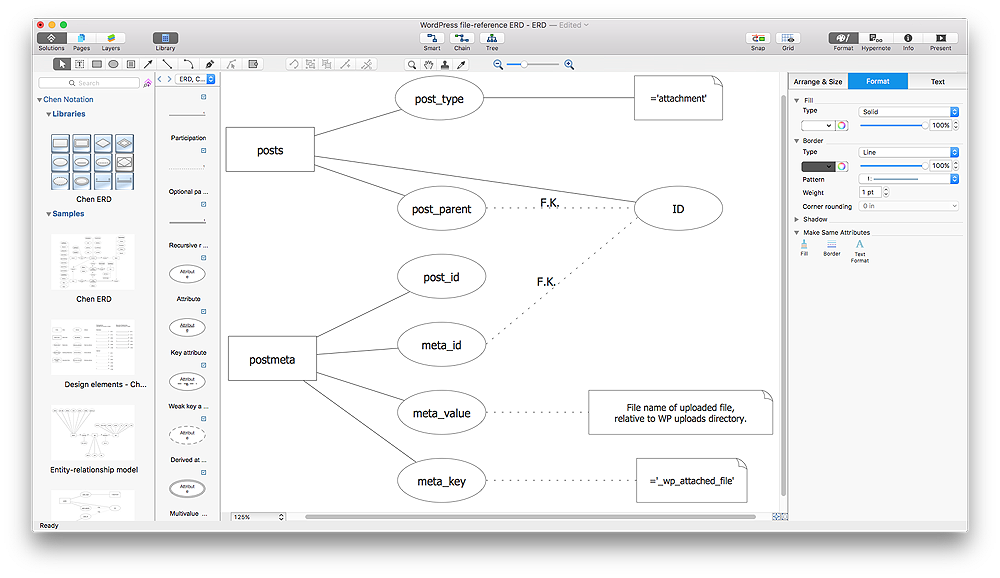
How To Make Chen ER Diagram
The Chen ERD notation model is a popular standard and is widely used worldwide in database and software design. The entity-relationship model proposed by Dr. Chen is constructed using a natural view of how the real world comprises entities and the relationships that exist with these identified entities. It was designed to leverage the advantages of the three entity-data models (network model, relationship model, entity model). The free Chen Notation solution for ConceptDraw PRO provides vector stencil libraries with full standardized Chen notation included.
 Entity-Relationship Diagram (ERD)
An Entity-Relationship Diagram (ERD) is a visual presentation of entities and relationships. That type of diagrams is often used in the semi-structured or unstructured data in databases and information systems. At first glance ERD is similar to a flowch
 Education Package
Education Package is a comprehensive set of multifarious graphical solutions from ConceptDraw Solution Park, collected together in help to ConceptDraw PRO users working in a field of science, education and training, which is aimed at improving the quality of education and helping to design with ease variety of interesting and colorful educational materials, diagrams, charts and maps. Use it to present the information and knowledge in an interesting, clear, structured and simple form to achieve a success in education and pedagogy, to maintain the interest of students and pupils throughout the whole learning process, at the lectures, lessons and even during independent work with additional materials, to contribute to better perception of scientific information by listeners during the conferences and reports.
- Tree Diagram Linguistics Generator
- Syntax Tree Diagram Generator Online Free
- Tree Diagram Generator Online Linguistics
- Sentence Tree Diagram Generator Online
- Tree Diagram Maker Linguistics
- Tree Diagram In Linguistics Example
- Linguistics Tree Diagram Generator
- Tree Diagram Generator Online Free
- Syntax Tree Diagram Generator Online
- Sentence Diagram | Tree Structure Linguistics Generator
- Tree Diagram Generator Linguistics
- Sentece Tree Diagram Generator Online Conceptdraw
- Sentence Diagram | Word Tree Generator Linguistics
- Sentence Diagram | Syntactic Trees Generator
- Linguistic Tree Diagram Generator
- Online Tree Diagram Generator
- Sentence Diagram | Syntactic Tree Generator
- Syntax Tree Diagram Generator
- Solutions Of Tree Diagram In Linguistics

