Process Flowchart
The main reason of using Process Flowchart or PFD is to show relations between major parts of the system. Process Flowcharts are used in process engineering and chemical industry where there is a requirement of depicting relationships between major components only and not include minor parts. Process Flowcharts for single unit or multiple units differ in their structure and implementation. ConceptDraw PRO is Professional business process mapping software for making Process flowcharts, Process flow diagram, Workflow diagram, flowcharts and technical illustrations for business documents and also comprehensive visio for mac application. Easier define and document basic work and data flows, financial, production and quality management processes to increase efficiency of your business with ConcepDraw PRO. Business process mapping software with Flowchart Maker ConceptDraw PRO includes extensive drawing tools, rich examples and templates, process flowchart symbols and shape libraries, smart connectors that allow you create the flowcharts of complex processes, process flow diagrams, procedures and information exchange. Process Flowchart Solution is project management workflow tools which is part ConceptDraw Project marketing project management software. Drawing charts, diagrams, and network layouts has long been the monopoly of Microsoft Visio, making Mac users to struggle when needing such visio alternative like visio for mac, it requires only to view features, make a minor edit to, or print a diagram or chart. Thankfully to MS Visio alternative like ConceptDraw PRO software, this is cross-platform charting and business process management tool, now visio alternative for making sort of visio diagram is not a problem anymore however many people still name it business process visio tools.
Data structure diagram with ConceptDraw PRO
Data structure diagram (DSD) is intended for description of conceptual models of data (concepts and connections between them) in the graphic format for more obviousness. Data structure diagram includes entities description, connections between them and obligatory conditions and requirements which connect them. Create Data structure diagram with ConceptDraw PRO.
 Venn Diagrams
Venn Diagrams are actively used to illustrate simple set relationships in set theory and probability theory, logic and statistics, mathematics and computer science, linguistics, sociology, and marketing. Venn Diagrams are also often used to visually summarize the status and future viability of a project.
Mechanical Engineering
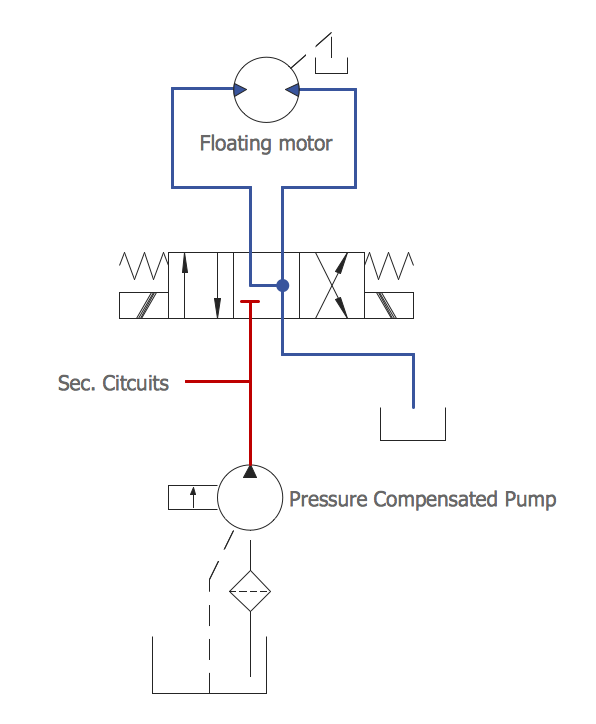
ConceptDraw PRO is the best diagramming and vector drawing software. Now, enhanced with Mechanical Engineering solution from the Engineering area of ConceptDraw Solution Park it became ideal for creating: Technical Mechanical Drawings, Mechanical Engineering Diagrams, Pneumatic Schematics, Hydraulic Schemes, etc.How to create a UML Diagram
ConceptDraw PRO extended with the Rapid UML solution is perfect for drawing professional UML diagrams.
 Biology
Biology solution extends ConceptDraw PRO software with samples, templates and libraries containing biological vector symbols, to help you create scientific and educational designs in the field of biology.
 Mechanical Engineering
This solution extends ConceptDraw PRO v.9 mechanical drawing software (or later) with samples of mechanical drawing symbols, templates and libraries of design elements, for help when drafting mechanical engineering drawings, or parts, assembly, pneumatic,
 Seven Management and Planning Tools
Seven Management and Planning Tools solution extends ConceptDraw PRO and ConceptDraw MINDMAP with features, templates, samples and libraries of vector stencils for drawing management mind maps and diagrams.
 Active Directory Diagrams
Active Directory Diagrams solution significantly extends the capabilities of ConceptDraw PRO software with special Active Directory samples, convenient template and libraries of Active Directory vector stencils, common icons of sites and services, icons of LDPA elements, which were developed to help you in planning and modelling network structures and network topologies, in designing excellently looking Active Directory diagrams, Active Directory Structure diagrams, and Active Directory Services diagram, which are perfect way to visualize detailed structures of Microsoft Windows networks, Active Directory Domain topology, Active Directory Site topology, Organizational Units (OU), and Exchange Server organization.
Software development with ConceptDraw Products
Internet solutions on ConceptDraw base. What may interest developers of Internet solutions.The Best Flowchart Software Available
ConceptDraw gives the ability to draw Flowchart documents. Flowcharts solutionis a powerful tool that extends ConceptDraw application for drawing business flowcharts. ConceptDraw PRO vector diagramming and business graphics software enhanced with with templates, green and interactive flowchart makers, samples and stencil libraries from ConceptDraw Solution Park which all focused to help with drawing flowcharts, block diagrams, bar charts, histograms, pie charts, divided bar diagrams, line graphs, area charts, scatter plots, circular arrows diagrams, Venn diagrams, bubble diagrams, concept maps, and others.
 ATM UML Diagrams
The ATM UML Diagrams solution lets you create ATM solutions and UML examples. Use ConceptDraw PRO as a UML diagram creator to visualize a banking system.
Electrical Diagram Software
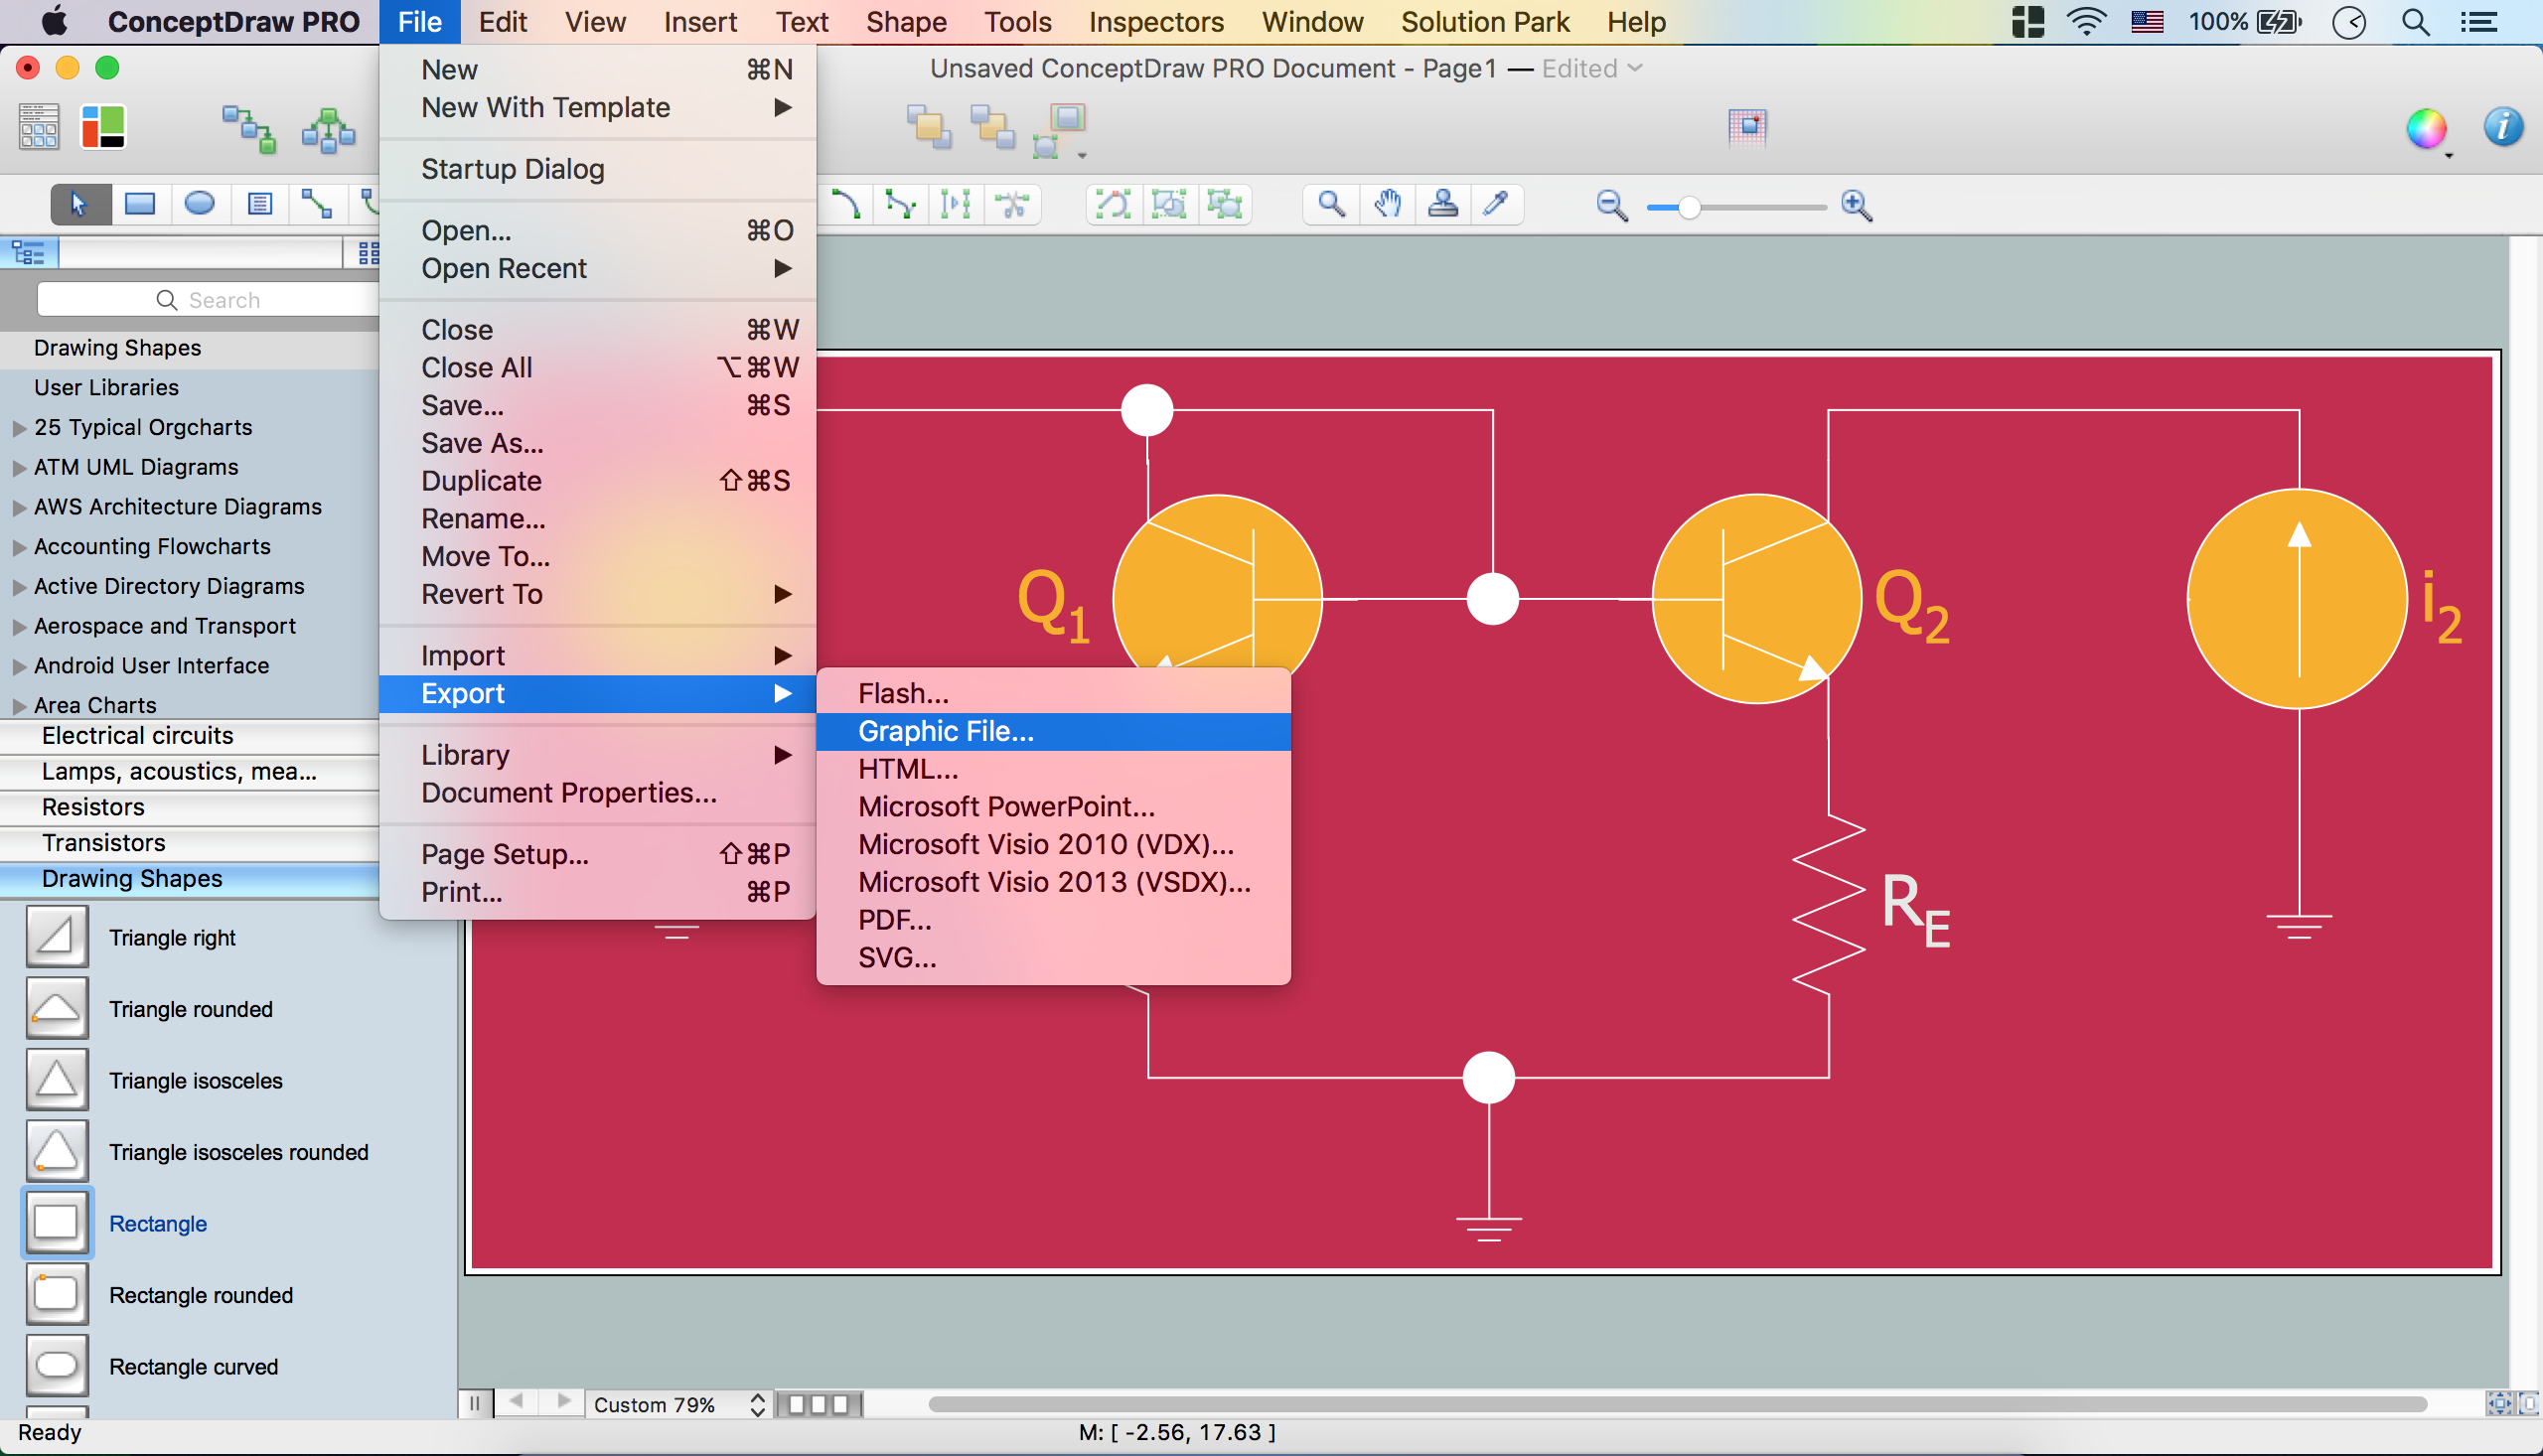
Electrical engineering and electronic engineering are extensive fields dedicated to research, design, development, manufacturing, test, and montage of systems and devices of electricity, electronics, microelectronics, telecommunications, power engineering, etc. These fields use various types of schemes, diagrams, technical drawings and require a special precision, accuracy and attention at their construction and using. The availability of modern specialized software has great importance for electrical engineers and electronic specialists, it assists them in drawing Electrical schematics and diagrams, Electrical drawings and Wiring schemes, Electronic Circuit schematics, etc. One of such software is ConceptDraw PRO extended with Electrical Engineering Solution that offers powerful drawing tools, wide variety of samples and libraries with numerous quantity of predesigned electrical symbols and vector objects of electrical devices. All they help design with minimal efforts Electrical diagrams and blueprints of any complexity, now drawing process is easy even for beginners.
In searching of alternative to MS Visio for MAC and PC with ConceptDraw PRO
Undoubtedly MS Visio is a powerful and multifunctional tool, but however at times occur the instances, when it turns unable of meeting certain users' requirements. At this cases you may need to use an alternative program software, preferably it will be simple, convenient, and at the same time powerful and professional. In searching the alternative to MS Visio for MAC and PC we recommend you to pay attention for ConceptDraw PRO software, which was developed to satisfy all your drawing needs and requirements. It is a fully-functioned alternative product to MS Visio for both platforms. ConceptDraw PRO software has many advantages, the main among them are the cross-platform compatibility, a reasonable price, widespread ConceptDraw Solution Park with huge variety of different solutions that offer numerous libraries of specialized vector objects, useful examples, samples, and quick-start templates, extensive import / export capabilities, built-in script language, MS Visio support and certainly free technical support.- Decision Tree In Software Engineering With Example
- Tree Diagram Of Became Electrical Engineer
- A Tree Diagram To Be A Software Engineer
- Fault Tree Analysis Software | Fault Tree Diagram | Fault Tree ...
- Tree Diagram Of Types Of Engineering Design
- PROBLEM ANALYSIS. Root Cause Analysis Tree Diagram | Entity ...
- Flowchart To Become A Software Engineer
- Tree Diagram Transformer
- Physics Symbols | Astronomy | Types of Flowcharts | Tree Diagram ...
- Information On Transformer Through Tree Diagram
- Mechanical Drawing Symbols | Mechanical Engineering | Fault Tree ...
- Tree Diagram Of Solar System
- SWOT analysis matrix diagram templates | Context Diagram ...
- Vector Diagrams Machanical Engineering
- Tool Engineer Ms Visio
- Most Useful Diagram Used In Mechanical Engineering
- Process Engineering | Mechanical Engineering | Chemical ...
- Diagram Of Mechanical Engineer
- Venn Diagrams | Systems engineering improvement | Venn Diagram ...


