This site uses cookies. By continuing to browse the ConceptDraw site you are agreeing to our Use of Site Cookies.

Fault Tree Diagram

ConceptDraw DIAGRAM diagramming and vector drawing software offers the Fault Tree Analysis Diagrams Solution from the Industrial Engineering Area of ConceptDraw Solution Park for quick and easy creating the Fault Tree Diagram of any degree of detailing.

fault tree analysis, fishbone diagram, cause and effect diagrams, fault tree analysis software, fault tree analysis example Fault Tree Analysis Diagrams

fault tree analysis, fishbone diagram, cause and effect diagrams, fault tree analysis software, fault tree analysis example
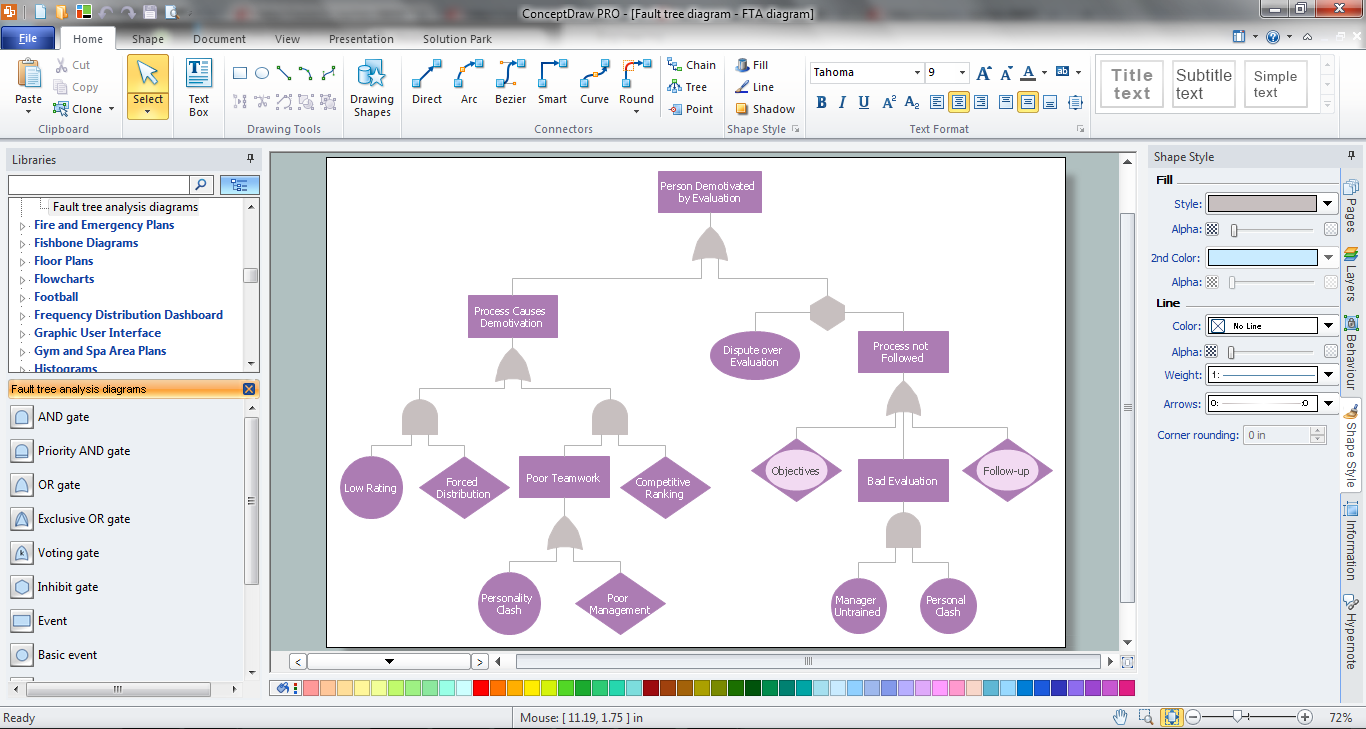
This solution extends ConceptDraw DIAGRAM.5 or later with templates, fault tree analysis example, samples and a library of vector design elements for drawing FTA diagrams (or negative analytical trees), cause and effect diagrams and fault tree diagrams.

The Best Flowchart Software Available

ConceptDraw gives the ability to draw Flowchart documents. Flowcharts solutionis a powerful tool that extends ConceptDraw application for drawing business flowcharts.
ConceptDraw DIAGRAM vector diagramming and business graphics software enhanced with with templates, green and interactive flowchart makers, samples and stencil libraries from ConceptDraw Solution Park which all focused to help with drawing flowcharts, block diagrams, bar charts, histograms, pie charts, divided bar diagrams, line graphs, area charts, scatter plots, circular arrows diagrams, Venn diagrams, bubble diagrams, concept maps, and others.

Influence Diagram Software

Influence diagram (ID) is a graphical and mathematical representation of the decision. Influence diagrams are widely used in the decision analysis and in the game theory. They are the alternative to the decision tree. The influence diagram gives to analyst the high-level conceptual view that it can use to build the detailed quantitative model.
This sample shows the Influence diagram. It is a directed acyclic graph with three types of nodes: Decision node is drawn as a rectangle, Uncertainty node is drawn as an oval, Value node is drawn as an octagon. The nodes are connected with arcs.

Decision Making

Decision Making - ConceptDraw OFFICE suite provides visual tools that are given support on the stage of the decision making.
The Seven Management and Planning Tools is a set for such diagrams: Affinity Diagram, Relations Diagram, Prioritization Matrix, Root Cause Tree Diagram, Involvement Matrix, PERT Chart, Risk Diagram (PDPC).

Cause and Effect Analysis

Cause and Effect Analysis - The Seven Management and Planning Tools is a tool for Cause and Effect Analysis that allows users to analyze the root causes for factors that influenced the problem. This diagram is constructed separately for each highly prioritized factor. The Diagram is then used for further formulation of potential actions.
7MP Tools
7MP Tools

Fault Tree Analysis Software

ConceptDraw DIAGRAM extended with Fault Tree Analysis Diagrams Solution from the Industrial Engineering Area of ConceptDraw Solution Park is the best Fault Tree Analysis Software.
First of all, Fault Tree Analysis Diagrams Solution provides a set of samples which are the good examples of easy drawing professional looking Fault Tree Analysis Diagrams.

Project — Working With Tasks

A full-featured project management solution with all the necessary functions right at your fingertips. Generates an extensive variety of reports on project and task statuses.
These videos provide a series of lessons that will enhance the understanding of all our users, from people just starting out with the software, through to expert users.

Root Cause Tree Diagram

Analyze the root causes of factors that influence the problem. A diagram is constructed separately for each high priority factor. Identify the root causes for a factor and then propose possible corrective actions. The diagram displays the structure of causes for a factor and possible corrective actions. The Root Cause Analysis Tree Diagram is used for further formulation of actions.

TQM Diagram — Professional Total Quality Management

The Total Quality Management Diagram solution helps you and your organization visualize business and industrial processes. Create Total Quality Management diagrams for business process with ConceptDraw software.