Fault Tree Analysis Software
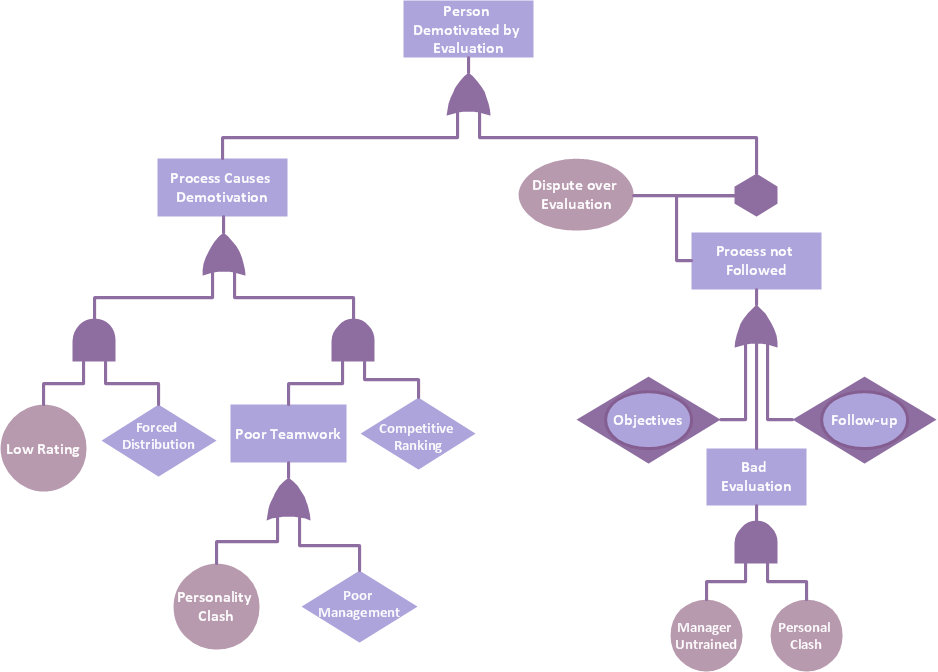
ConceptDraw DIAGRAM extended with Fault Tree Analysis Diagrams Solution from the Industrial Engineering Area of ConceptDraw Solution Park is the best Fault Tree Analysis Software. First of all, Fault Tree Analysis Diagrams Solution provides a set of samples which are the good examples of easy drawing professional looking Fault Tree Analysis Diagrams.Fault Tree Analysis Example
Designing the Fault Tree Analysis (FTA) Diagrams first of all it is important to have a powerful software. ConceptDraw DIAGRAM diagramming and vector drawing software extended with Fault Tree Analysis Diagrams Solution from the Industrial Engineering Area is exactly what you need. It is also convenient to have professional looking Fault Tree Analysis example before the eyes, and it is excellent that this solution includes large collection of such examples.Fault Tree Diagram
ConceptDraw DIAGRAM diagramming and vector drawing software offers the Fault Tree Analysis Diagrams Solution from the Industrial Engineering Area of ConceptDraw Solution Park for quick and easy creating the Fault Tree Diagram of any degree of detailing.Fault Tree Analysis Diagrams
This solution extends ConceptDraw DIAGRAM.5 or later with templates, fault tree analysis example, samples and a library of vector design elements for drawing FTA diagrams (or negative analytical trees), cause and effect diagrams and fault tree diagrams.
HelpDesk
How to Draw a Family Tree
Exploring family history is essential to keep the hereditary memory alive and allow each generation to know who they are and where they come from. The Family Tree Solution for ConceptDraw DIAGRAM allows you allows you to draw family trees and pedigree charts quickly and effortlessly.PROBLEM ANALYSIS. Root Cause Analysis Tree Diagram
Root Cause Analysis Tree Diagram. Use the Root Cause Diagram to perform visual root cause analysis. Root Cause Analysis Tree Diagram is constructed separately for each highly prioritized factor. The goal of this is to find the root causes for the factor and list possible corrective action. ConceptDraw Office suite is a software for problem analysis.ConceptDraw Solution Park
ConceptDraw Solution Park collects graphic extensions, examples and learning materials
Entity Relationship Diagram - ERD - Software for Design Crows Foot ER Diagrams
ER-model is a data model which lets describe the conceptual schemes in a specific subject area. It can help to highlight the key entities and specify relationships that can be established between these entities. During the database design, it is realized the transformation of ER model into certain database scheme based on the chosen data model (relational, object, network, etc.). There are used two notations for ERDs: Crow's Foot and Chen's. Crow's Foot notation proposed by Gordon Everest represents the entity by rectangle containing its name (name must be unique within this model), and relation - by the line which links two entities involved in relationship. The relationship's plurality is graphically indicated by a "plug" on the end of the link, the optionality - by a circle. Entity-Relationship Diagrams based on Crow's Foot notation can be easily drawn using the ConceptDraw DIAGRAM. Extended with Entity-Relationship Diagram (ERD) solution, it is the best ERD diagrams software with powerful tools and ready design elements for Crow's Foot and Chen notations.Wireless Network Setup
ConceptDraw Wireless Networks solution is a bundle of the vector stencils, examples, and templates for drawing different types of wireless network diagrams.Family Tree
A family tree, genealogy chart, or pedigree chart is a visual representation of a person’s lineage. It depicts the family relationships in a tree structure with one individual as the root. A family tree allows tracing common ancestors, overseeing the lineage of each individual family member by tracing the branches leading from him to the root. Start discovering your family story with ConceptDraw DIAGRAM and its Genogram solution, and you will make a professionally-looking family tree or family genogram in minutes. When your diagram is ready, you can share it with your family, friends, or some other people directly from the application.HelpDesk
How to Create a Fault Tree Analysis Diagram (FTD)
Fault Tree Diagram is a logic diagram that shows the state of an entire system in a relationship of the conditions of its elements. Fault Tree Diagram is used to analyze the probability of functional system failures and safety accidents. ConceptDraw DIAGRAM allows you to create professional Fault Tree Diagrams using the basic FTD symbols. An FTD visualizes a model of the processes within a system that can lead to the unlikely event. A fault tree diagrams are created using standard logic symbols. The basic elements in a fault tree diagram are gates and events.ConceptDraw Solution Park
ConceptDraw Solution Park collects graphic extensions, examples and learning materials
Root Cause Analysis
The Seven Management and Planning Tools is a tool for Root Cause Analysis Tree Diagram drawing. This diagram is for Root Cause Analysis. Analyze the root causes for factors that influenced the problem. This diagram is constructed separately for each highly prioritized factor. The goal of this is to find the root causes for the factor and list possible corrective action.Telecom Wireless Plan
ConceptDraw DIAGRAM diagramming and vector drawing software extended with Electric and Telecom Plans Solution from the Building Plans Area is the best software for drawing the Telecom Wireless Plan of any complexity.Class Hierarchy Tree
Class Hierarchy Tree solution enhances the ConceptDraw DIAGRAM and ConceptDraw MINDMAP software functionalities with a wide collection of samples and a large set of pre-made vector shapes, smart and direct connectors allowing all IT and web specialists, web-designers, web-programmers, and lecturers to design the Class Hierarchy Trees and Class Diagrams, object oriented classes, making easier the object oriented programming, illustrating the object oriented programming concepts, the generalization and inheritance in Java class and Python class, as well as designing the Class Hierarchy Mind Maps and autogenerating them in Class Tree Diagrams in ConceptDraw DIAGRAM files.
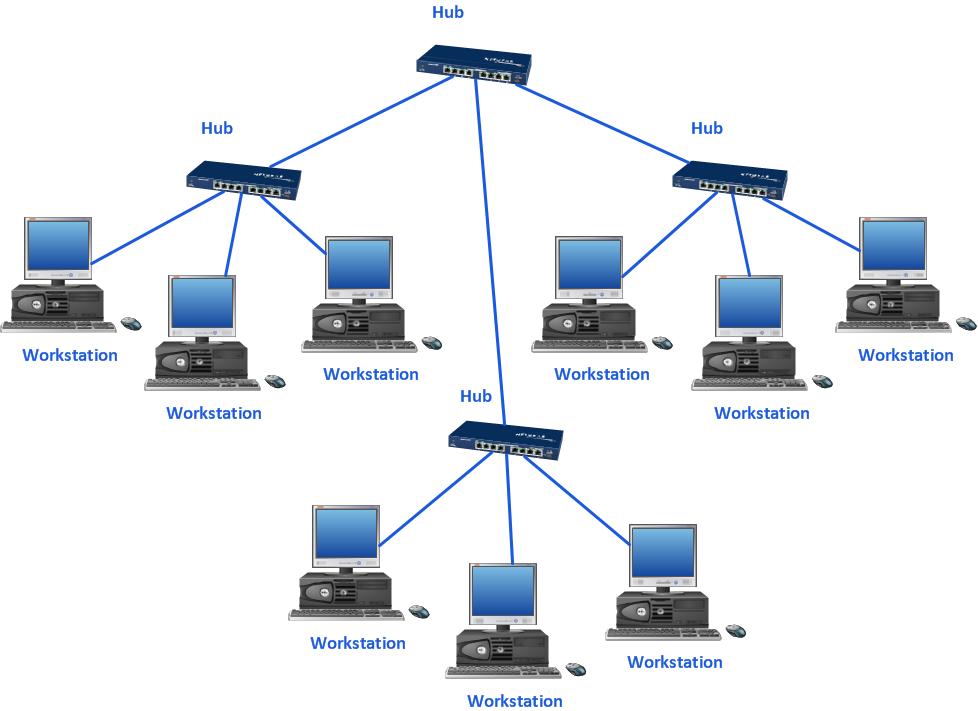
Design Element: Network Layout for Network Diagrams
ConceptDraw DIAGRAM is perfect for software designers and software developers who need to draw Network Layout Diagrams.HelpDesk
How to Create a DOM Tree Diagram
The DOM Tree solution provides support for drawing DOM-tree in ConceptDraw DIAGRAM and for making DOM-tree mind maps in ConceptDraw MINDMAP with the ability to automatically generate DOM diagrams in DIAGRAM. With the DOM-tree solution, programmers can create HTML and XML documents, navigate their structure, add, modify, and delete elements and content.DOM Tree
DOM Tree solution extends the functionality of ConceptDraw DIAGRAM and ConceptDraw MINDMAP software making them ideal for designing the Document Object Model, DOM hierarchy and DOM tree diagram. You are free to choose — design your DOM document object model in ConceptDraw DIAGRAM or create the DOM Tree Mind Map in ConceptDraw MINDMAP and then automatically generate it to DOM tree diagram in ConceptDraw DIAGRAM file. This solution includes a lot of samples and predesigned vector shapes, smart and direct connectors for fast and easy drawing strict, informative and professional-looking DOM model, DOM trees, DOM hierarchies, DOM document structures, and DOM Tree Mind Maps.
Pictures of Graphs
ConceptDraw DIAGRAM diagramming and vector drawing software extended with Picture Graphs solution from the Graphs and Charts Area is the best choice for making professional looking pictures of graphs and colorful picture graphs.- Fault Tree Analysis Software | TQM Diagram — Professional Total ...
- Fault Tree Analysis Diagrams | Fault Tree Diagram | Professional ...
- Professional Diagram and Flowchart Software | Venn Diagrams ...
- Fault Tree Diagram | How to Create a Fault Tree Analysis Diagram ...
- Fault Tree Analysis Diagrams | Fault Tree Analysis Software
- Fault Tree Analysis Diagrams | Fishbone Diagrams | Fishbone ...
- Free Fault Tree Analysis Program
- Solving quadratic equation algorithm | Flowchart For B Tree
- Fault Tree Analysis Software - Conceptdraw.com