Export from ConceptDraw DIAGRAM Document to a Graphic File
Now it’s easy to share your visual documents with other people in a form most convenient for them. ConceptDraw DIAGRAM can save your drawings and diagrams in a number of highly useful formats, including graphic files. You can save your drawing as a.PNG,.JPG, or other graphic format file.
Pyramid Diagram
Triangle diagram example of DIKW pyramid has 4 levels: data, information, knowledge and wisdom.Pyramid Diagram
Pyramid diagram is a chart used to visualize the data in a hierarchical (pyramid-like) structure and depict the foundation-based relationships. Pyramid diagram looks like a triangle divided by lines into several sections (layers) and can be oriented up or down, and represented in 2D or 3D view. 2D Pyramid diagrams are a great way to illustrate the hierarchical structure, 3D Pyramids are equally good to represent the class stratification and hierarchy. ConceptDraw DIAGRAM diagramming and vector drawing software with included Pyramid Diagrams solution from Marketing area of ConceptDraw Solution Park is a powerful application which contains templates and library of vector design elements for instantly drawing three level Pyramid model, four level and five level Triangle charts. All predesigned objects are easy for changing color style and resizing according to your needs, and ConceptDraw documents with Pyramid diagrams can be easy exported in various formats for further using in marketing presentations, for effective analyzing hierarchy levels and illustration your data and ideas.Pyramid Diagram
A Venn-diagram style chart of the "project triangle" showing visually the potential overlaps between speed, quality and low cost, along with the "inability" to accomplish all three.Pyramid Diagram
The Project Management Triangle Diagram depicts three main constraints of any project: scope, time and cost. Projects have to comply with the specified scope, projects should be finished in time and projects need to consume the budget. Each of the constraints represents one side of the triangle, and any change in budget or timing or scope affects the entire diagram. This diagram was made using ConceptDraw Office suite including best marketing project management software extended with collection of tools for creative project management software and project management reporting software symbols.Flowchart design. Flowchart symbols, shapes, stencils and icons
A flowchart is a type of diagram which represents an algorithm, process or workflow, displays the steps as boxes of various kinds and depicts their order by connecting them with arrows. Any business graphic document will be more colorful and understandable if will use professional-looking and visual diagrams and flowcharts. Flowchart design gives versatile presenting and explaining of the process. ConceptDraw DIAGRAM flowchart software enhanced with Flowcharts solution helps effectively make Flowchart Design. Use of predesigned flowchart symbols and bright color palette offers a fresh view and favorably distinguishes the flowcharts designed in ConceptDraw DIAGRAM from the black and white flowcharts on a paper. Preferably to use no more than three or four colors and apply identical for the same shape types. The best flowchart design can be achieved by starting with Flowchart template, or any of suitable ready examples or samples offered in ConceptDraw STORE, open one of them and enter the proper text into each Flowchart shape. Each symbol of the flowchart has a definition that can't be changed. This means that all flowcharts shapes can be grouped in according to their meaning. Users with ConceptDraw DIAGRAM flowchart software can style groups of symbols with close definitions by color sets chosen from complementary palette. Almost all workflows can be depicted as a flowchart. Colored diagrams are more light for perception of the certain information, this is part of flowchart design. Bright colors need to be used in the key points of Decision symbols, to focus attention on their importance for whole process flow.
Pyramid Diagram
Pyramid diagrams help you visualize information as a triangle divided into horizontal slices. Labelled slices represent a hierarchy. Pyramids are used in marketing presentations to show and analyze hierarchy levels. 3D triangular diagram of DIKW pyramid has 6 levels: measurement, facts, data, information, knowledge, wisdom. The data component include different scattered signs or symbols which are merely useless until these random objective facts are somehow processed. Data is a resource which has to be manipulated or rearranged to get useful. Information can be extracted from a pile of data, it also can be mined from different data storages.The vector stencils library "Progressive disclosure controls" contains 12 icons of Windows 8 progressive disclosure controls.
Use it to design graphic user interface (GUI) prototypes of your software applications for Windows 8.
"With a progressive disclosure control, users can show or hide additional information including data, options, or commands. Progressive disclosure promotes simplicity by focusing on the essential, yet revealing additional detail as needed. ...
Chevrons show or hide the remaining items in completely or partially hidden content. Usually the items are shown in place, but they can also be shown in a pop-up menu. When in place, the item stays expanded until the user collapses it. ...
Arrows show a pop-up command menu. The item stays expanded until the user makes a selection or clicks anywhere.
If the arrow button is an independent control, it receives input focus and is activated with the space bar. If the arrow button has a parent control, the parent receives input focus and the arrow is activated with Alt+down arrow and Alt+up arrow keys, as with the drop-down list control. ...
Plus and minus controls expand or collapse to show container content in place when navigating through a hierarchy. The item stays expanded until the user collapses it. Although these look like buttons, their behavior is in-place.
The associated object receives input focus. The plus is activated with the right arrow key, and the minus with the left arrow key. ...
Rotating triangles show or hide additional information in place for an individual item. They are also used to expand containers. The item stays expanded until the user collapses it.
The associated object receives input focus. The collapsed (right-pointing) triangle is activated with the right arrow key, and the expanded (downward-pointing) triangle with the left arrow key. ...
Like chevrons, additional information is shown or hidden in place. The item stays expanded until the user collapses it. Unlike chevrons, the glyphs have a graphical representation of the action, typically with an arrow indicating what will happen. ... Preview arrows are best reserved for situations where a standard chevron doesn't adequately communicate the control's behavior, such as when the disclosure is complex or there is more than one type of disclosure." [msdn.microsoft.com/ en-us/ library/ windows/ desktop/ dn742409%28v=vs.85%29.aspx]
The icons example "Progressive disclosure controls - Vector stencils library" was created using the ConceptDraw PRO diagramming and vector drawing software extended with the Windows 8 User Interface solution from the Software Development area of ConceptDraw Solution Park.
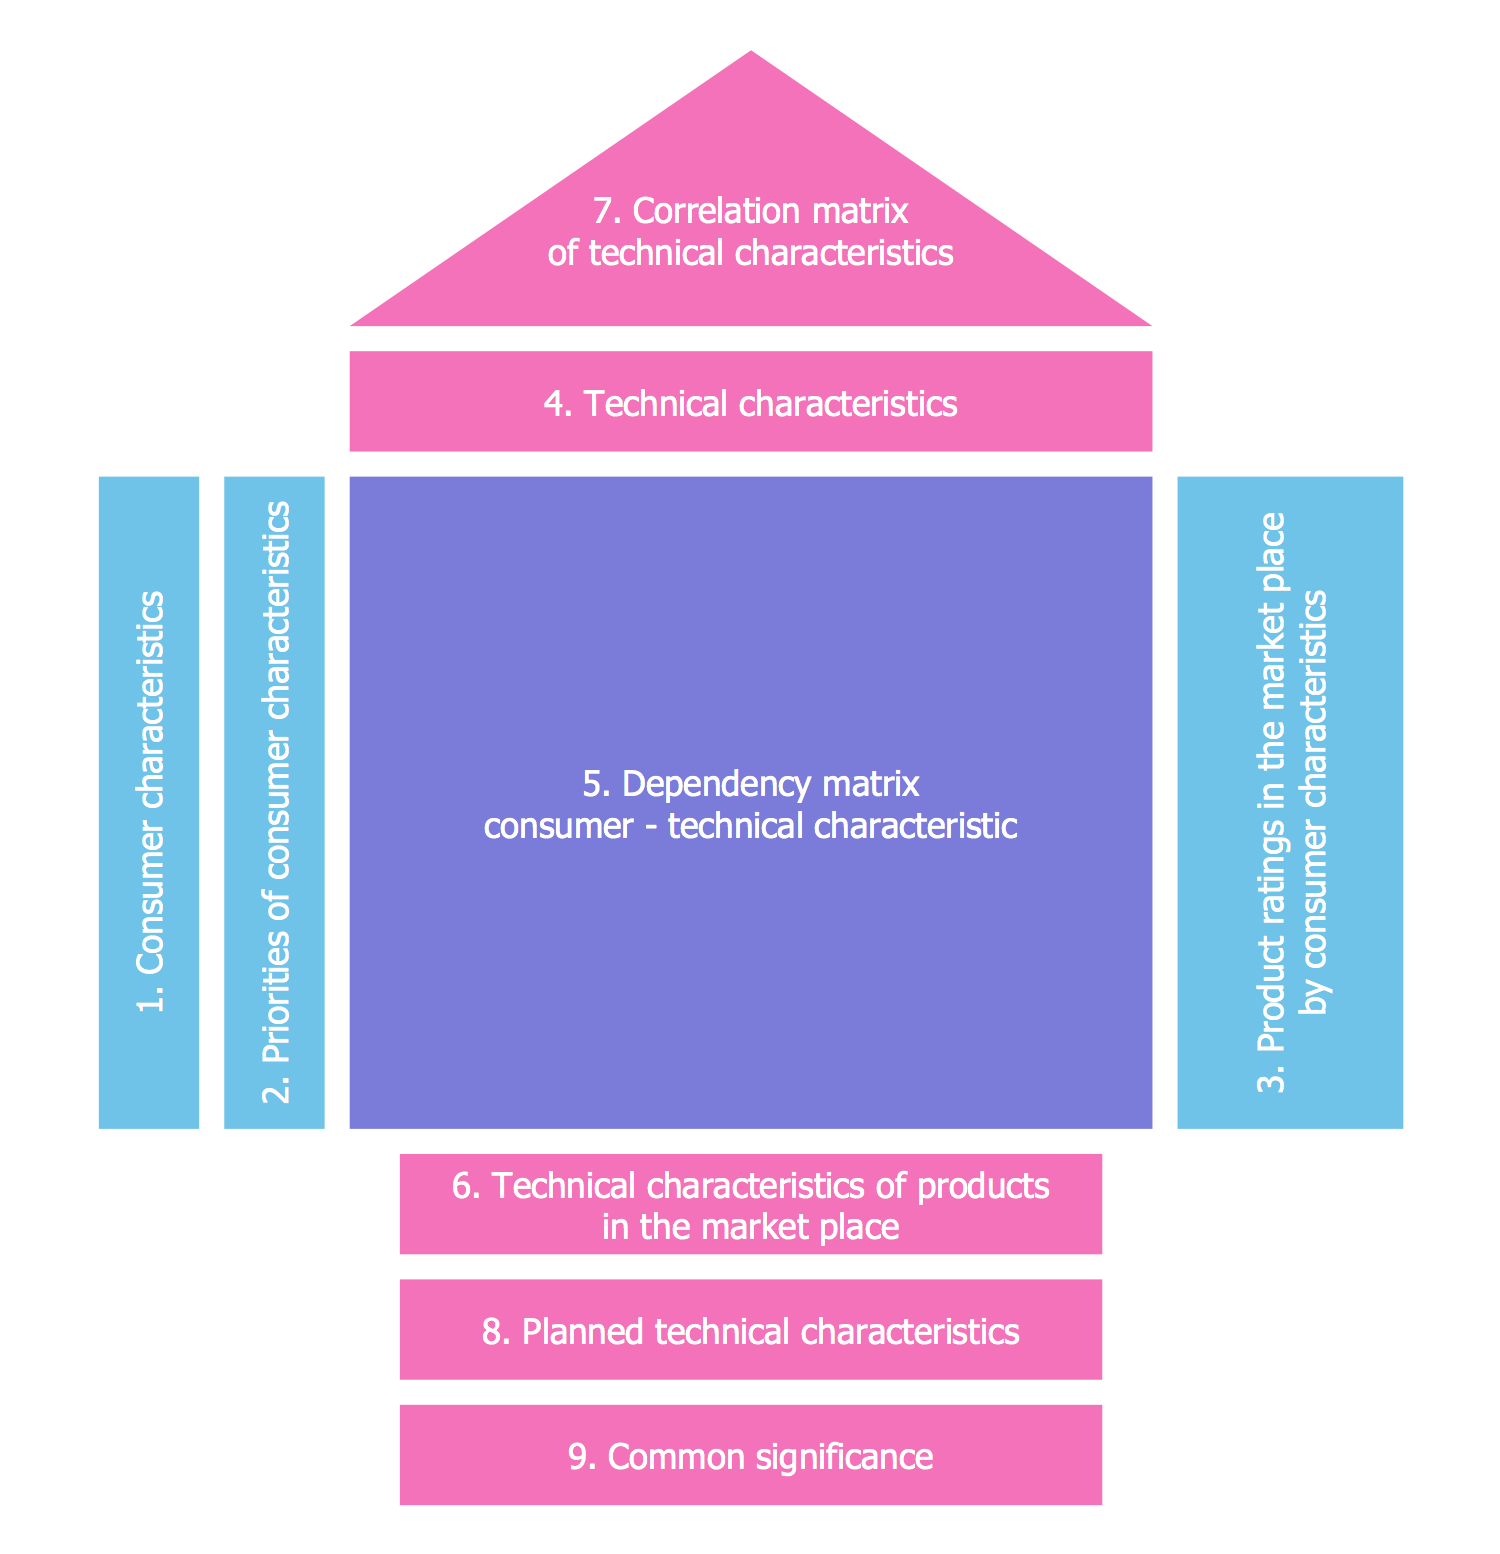
QFD | Quality Function Deployment Diagram
Having both mentioned tools anyone can make all the needed thematic drawings, such as the QFD diagrams and other HOQ ones, such as the HOQ matrices. Having the House of Quality solution downloaded from the ConceptDraw STORE application means having all the needed tools for creating the House of Quality drawings either using the design elements from one of two stencil libraries, such as a “House of Quality Symbols” one, or by having the pre-made templates as the drafts for creating the unique matrices and diagrams.Pyramid Diagram
ConceptDraw Pyramid Diagram software allows drawing column charts using predesigned objects or drawing tools.- Orange Triangle Png
- Png Button For Collapse Up Down
- Glyph icons - Vector stencils library | Css Search Png
- 4 Level pyramid model diagram - Information systems types ...
- Orange Triangle Bullet
- Combo Box Icon Png Double Arrow
- Triangle Back Icon Png White
- Red Arrow Png Long Double Head
- 3d Triangle Vector Png
- Single Chevron Png Free


