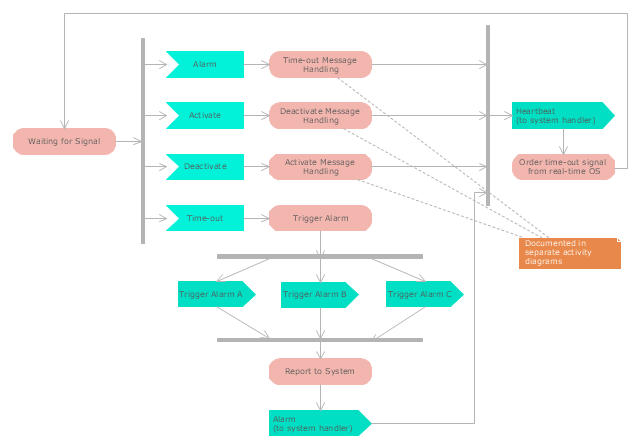
"Alarm triggers.
The individual triggers for a car alarm vary widely, depending on the make and model of the vehicle, and the brand and model of the alarm itself (for aftermarket alarms). Since aftermarket alarms are designed to be universal (i.e., compatible with all 12 volt negative ground electrical systems as opposed to one carmaker's vehicles), these commonly have trigger inputs that the installer/ vehicle owner chooses not to connect, which additionally determines what will set the alarm off." [Car alarm. Wikipedia]
The UML activity diagram example " Alarm trigger processing" was created using the ConceptDraw PRO diagramming and vector drawing software extended with the Rapid UML solution from the Software Development area of ConceptDraw Solution Park.
UML activity diagram
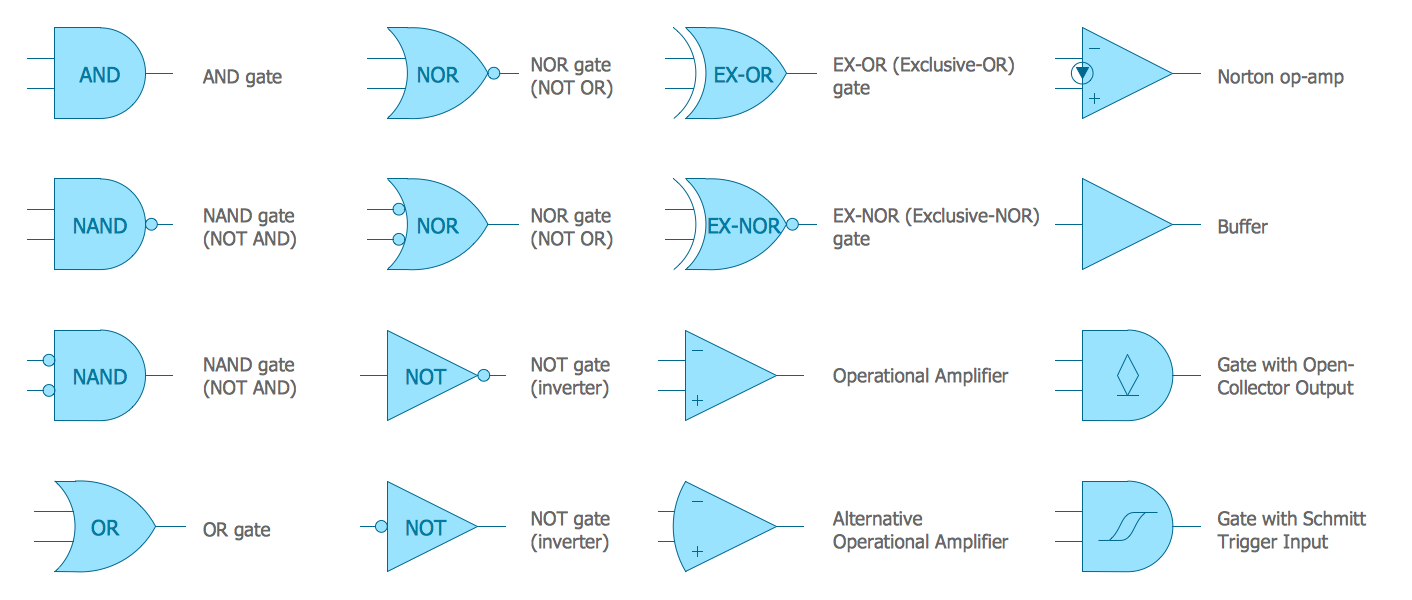
Electrical Symbols — Logic Gate Diagram
Process Flowchart


Cross-Functional Flowchart (Swim Lanes)

Entity Relationship Diagram - ERD - Software for Design Crows Foot ER Diagrams
_Win_Mac.png)

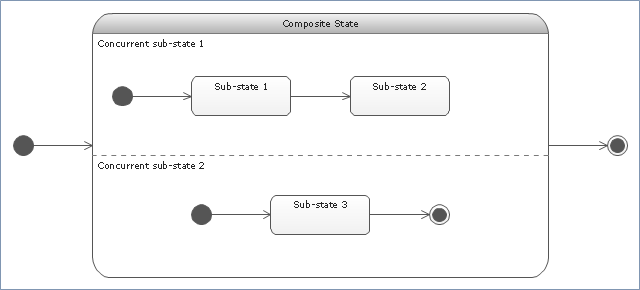
"State machine diagram is a behavior diagram which shows discrete behavior of a part of designed system through finite state transitions. State machine diagrams can also be used to express the usage protocol of part of a system. Two kinds of state machines defined in UML 2.4 are:
(1) behavioral state machine, and
(2) protocol state machine.
The following nodes and edges are typically drawn in state machine diagram: behavioral state, behavioral transition, protocol state, protocol transition, different pseudostates. ...
Behavioral state machine is specialization of behavior and is used to specify discrete behavior of a part of designed system through finite state transitions. The state machine formalism used in this case is an object-based variant of Harel statecharts.
Behavior is modeled as a traversal of a graph of state nodes connected with transitions. Transitions are triggered by the dispatching of series of events. During the traversal, the state machine could also execute some activities. ...
Protocol state machine is a specialization of behavioral state machine and is used to express usage protocol or lifecycle of a classifier. It specifies which operations of the classifier can be called in which state and under which condition, thus specifying the allowed call sequences on the classifier’s operations. Protocol state machines express the legal transitions that a classifier can trigger." [uml-diagrams.org/ state-machine-diagrams.html]
The template "UML state machine diagram" for the ConceptDraw PRO diagramming and vector drawing software is included in the Rapid UML solution from the Software Development area of ConceptDraw Solution Park.
www.conceptdraw.com/ solution-park/ software-uml
UML state machine diagram
Diagramming Software for Business Process

Diagramming Software for Design UML Activity Diagrams


OMT Method
- UML activity diagram - Alarm trigger processing | Rapid UML | Alarm ...
- Flowchart Symbol For Trigger
- UML activity diagram - Alarm trigger processing | Car Diagram
- UML activity diagram - Alarm trigger processing
- UML activity diagram - Alarm trigger processing | iPhone OS (iOS ...
- Trigger Icon
- UML activity diagram - Alarm trigger processing | Security system ...
- UML activity diagram - Alarm trigger processing | Aerospace and ...
- UML activity diagram - Alarm trigger processing | SYSML | Event ...