HelpDesk
How To Create an Affinity Diagram Using ConceptDraw Office
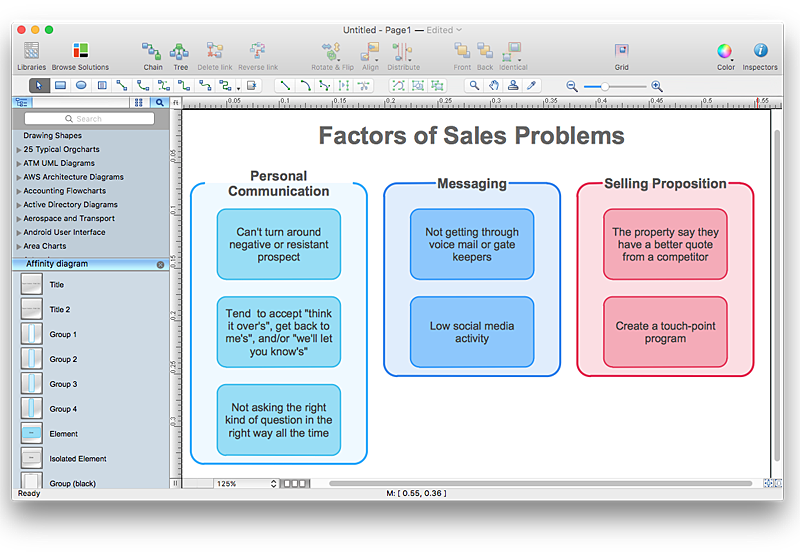
Affinity diagram is designed to prepare the data for further analysis of the cause-effect relationships.The Affinity diagram shows the structure of large, complex factors that have an influence on a problem, and then divides them up into a smaller and simpler structure. We recommend using a mind map for Brainstorming and collecting the factors affecting the problem. The ability to create an Affinity diagram from a mind map is supported by the ConceptDraw Seven Management and Planning Tools solution.- Fault Tree Analysis Diagrams | Root cause analysis tree diagram ...
- Using Fishbone Diagrams for Problem Solving | Fishbone Diagram ...
- Root cause analysis tree diagram - Template | Fault Tree Diagram ...
- How to Create SWOT Analysis Template Using ConceptDraw PRO ...
- Process Flowchart | Troubleshooting Tree
- PROBLEM ANALYSIS . Root Cause Analysis Tree Diagram | Root ...
- Process Flowchart | Troubleshooting Tree Software
- Fishbone Diagram | Cause and Effect Analysis (Fishbone Diagrams ...
- Troubleshooting in Wireless Connection | Basic Flowchart Symbols ...
- Manufacturing 8 Ms fishbone diagram - Template | Fishbone ...
- Process Flowchart | Decision Making | CORRECTIVE ACTIONS ...
- 4m Analysis Format
- Fishbone Analysis Template Ppt
- Process Flowchart | Troubleshooting Decision Tree
- How to Create SWOT Analysis Template Using ConceptDraw PRO ...
- Business Productivity Diagramming | Venn Diagram Examples for ...
- Cause and Effect Analysis (Fishbone Diagrams) | Using Fishbone ...
- Service 8 Ps fishbone diagram - Template | Fishbone Diagram ...
- How to Create a Fishbone (Ishikawa) Diagram Quickly | How To ...
- Decision tree diagram | Influence Diagram Software | Cause and ...
