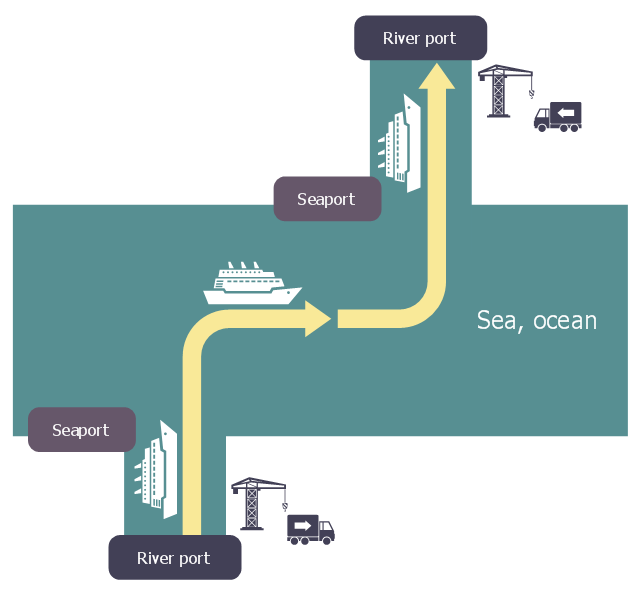
This logistic flow chart sample shows a chain of intermodal transport to link fluvio-maritime.
It was designed on the base of the Wikimedia Commons file: Logistique fluvio-maritime.jpg.
[commons.wikimedia.org/ wiki/ File:Logistique_ fluvio-maritime.jpg]
This file is licensed under the Creative Commons Attribution-Share Alike 3.0 Unported license. [creativecommons.org/ licenses/ by-sa/ 3.0/ deed.en]
"Intermodal freight transport involves the transportation of freight in an intermodal container or vehicle, using multiple modes of transportation (rail, ship, and truck), without any handling of the freight itself when changing modes. The method reduces cargo handling, and so improves security, reduces damage and loss, and allows freight to be transported faster. Reduced costs over road trucking is the key benefit for inter-continental use. This may be offset by reduced timings for road transport over shorter distances." [Intermodal freight transport. Wikipedia]
The logistic flowchart example "Intermodal transport chain" was created using ConceptDraw PRO diagramming and vector drawing software extended with the Logistics Flow Charts solution from the Business Processes area of ConceptDraw Solution Park.
Logistic flowchart
 Aerospace and Transport
This solution extends ConceptDraw PRO software with templates, samples and library of vector clipart for drawing the Aerospace and Transport Illustrations. It contains clipart of aerospace objects and transportation vehicles, office buildings and anci
"Value Stream Map (VSM)
1. A tool used to improve a process by identifying added value and eliminating waste.
2. A process map that follows the value creation process.
A. “strap yourself to the product (or service) and see where you go”
3. A process map with data added.
A. Times: processing, wait, cycle.
B. Quality: number of rejects.
C. Inventory.
D. Resources.
1) Number of people.
2) Space.
3) Distance traveled.
E. Whatever else is useful for analyzing the process." [ocw.mit.edu/ courses/ aeronautics-and-astronautics/ 16-660j-introduction-to-lean-six-sigma-methods-january-iap-2012/ lecture-notes/ MIT16_ 660JIAP12_ 1-6.pdf]
This sample VSM flowchart shows the value stream in a manufacturing, production control and shipping processes.
This value stream mapping diagram example was created using the ConceptDraw PRO diagramming and vector drawing software extended with the Value Stream Mapping solution from the Quality area of ConceptDraw Solution Park.
Value stream mapping

Cross Functional Flowchart Shapes Stencil

- Truck Transportation Business Flow Chart
- Flow chart Example. Warehouse Flowchart | Administration Process ...
- Flowchart Food Truck Restaurant
- Truck Loading Flow Chart
- Flow Chart Of Truck Transport Management System
- Aerospace and Transport | Flow chart Example. Warehouse ...
- Flow Chart Of Bulldozer Real Truck
- Flow Chart For Truck Transport Management System
- Food trailer water supply | Aerospace and Transport | Food Truck ...
- Process Flowchart | Food trailer water supply | Plumbing and Piping ...