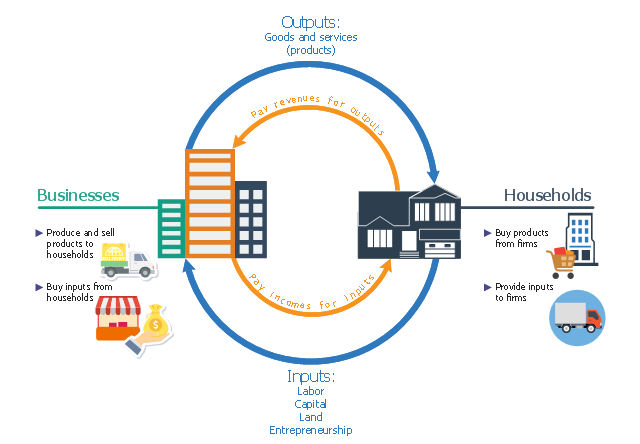
This business infographic sample shows the circular flow of inputs and outputs between businesses and households. It was designed on the base of the Wikimedia Commons file: Fundamentals of Business - Fig. 2.1 - Circular flow of inputs and outputs.jpg. [commons.wikimedia.org/ wiki/ File:Figure_ 2.1_ Circular_ flow_ of_ inputs_ and_ outputs.jpg]
This file is licensed under the Creative Commons Attribution 4.0 International license. [creativecommons.org/ licenses/ by/ 4.0/ deed.en]
"Many of the factors of production (or resources) are provided to businesses by households. For example, households provide businesses with labor (as workers), land and buildings (as landlords), and capital (as investors). In turn, businesses pay households for these resources by providing them with income, such as wages, rent, and interest. The resources obtained from households are then used by businesses to produce goods and services, which are sold to the same households that provide businesses with revenue. The revenue obtained by businesses is then used to buy additional resources, and the cycle continues." [saylor.org/ site/ textbooks/ Exploring%20 Business.pdf]
The business infographic example "Circular flow of inputs and outputs" was designed using ConceptDraw PRO diagramming and vector drawing software extended with the Business and Finance solution from Illustration area of ConceptDraw Solution Park.
- Truck Png Top
- Presentation Clipart | Truck vehicle clipart | Holiday | Engineering ...
- Presentation Clipart | Professions - Vector stencils library | Truck ...
- Mini Bus Vector Png
- Project management - Design Elements | Work Flow Chart | Design ...
- Road transport - Vector stencils library | Vehicular ad-hoc network ...
- Plumbing and Piping Plans | Interior Design Plumbing - Design ...
- How to Use Mind Map Filtering in ConceptDraw MINDMAP | How to ...
- Export from ConceptDraw PRO Document to a Graphic File | Scrum ...
- Kanban Board Software | Conceptual diagram of the Kanban ...
- Intelligent transportation system | Transportation Infographics | Road ...
- Vehicular Networking | Inter-vehicle communication systems ...
- Minihotel floor plan | House plumbing drawing | Security system floor ...
- Intelligent transportation system | Transportation Infographics | UML ...
- Food infogram - Reducing sodium | Activities calendar - FEMA ...
- Classroom and computer lab with overhead projector - Reflected ...
- Aerospace and Transport | Metro Map | Metro Map | Example Of Rail ...
- Vehicular ad-hoc network | Local vehicular networking - Vector ...
- Plumbing and Piping Plans | Building Drawing Software for ...
- Atmosphere air composition | Percentage Pie Chart. Pie Chart ...
