Basic Flowchart Symbols and Meaning
Flowcharts are the best for visually representation the business processes and the flow of a custom-order process through various departments within an organization. ConceptDraw PRO diagramming and vector drawing software extended with Flowcharts solution offers the full set of predesigned basic flowchart symbols which are gathered at two libraries: Flowchart and Flowcharts Rapid Draw. Among them are: process, terminator, decision, data, document, display, manual loop, and many other specific symbols. The meaning for each symbol offered by ConceptDraw gives the presentation about their proposed use in professional Flowcharts for business and technical processes, software algorithms, well-developed structures of web sites, Workflow diagrams, Process flow diagram and correlation in developing on-line instructional projects or business process system. Use of ready flow chart symbols in diagrams is incredibly useful - you need simply drag desired from the libraries to your document and arrange them in required order. There are a few serious alternatives to Visio for Mac, one of them is ConceptDraw PRO. It is one of the main contender with the most similar features and capabilities.
Emergency Plan
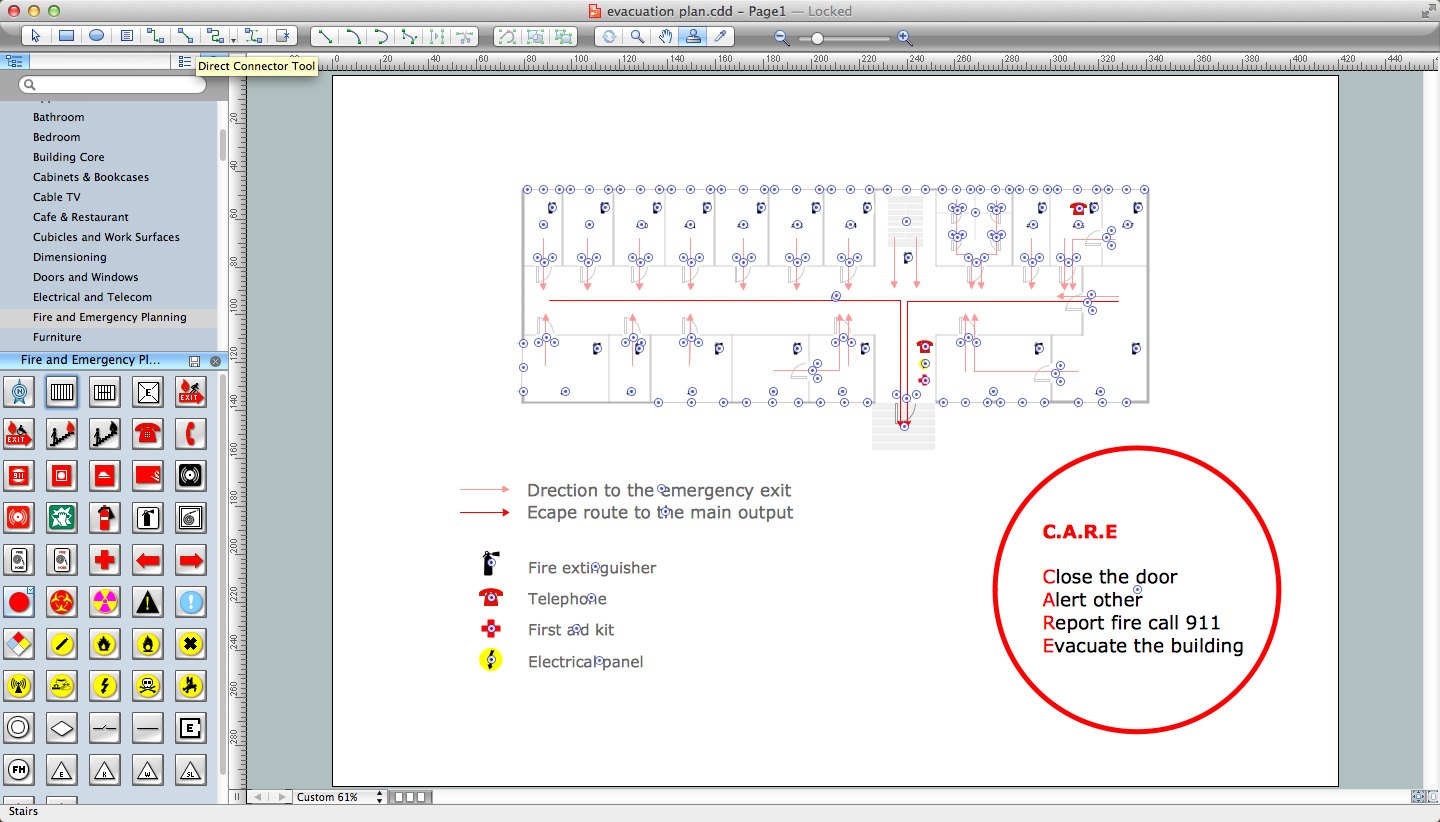
The Fire Emergency Plan illustrates the scheme of the building and location of the main and fire exits for a safe evacuation, and clearly defines directions to them on the plan. Fire Emergency Plans are constructed on the case of unexpected or emergency situations, fires, hazardous leaks, natural disasters, and other sudden events. They must to be obligatorily on the plain sight at every building and on each floor, at living houses and apartments, schools and universities, medical centers, clinics and hospitals, office buildings, banks, cafes, restaurants, and also at all other public buildings and institutions. The Evacuation plans and Emergency Plans preliminary designed in ConceptDraw PRO software help employees and family members when some emergency events happen and let avoid the accidents and sad consequences, prevent injuries and fatalities, allow reduce damages and speed the work resumption. Start drawing emergency blueprint from floor bounds, then add the inner walls and doors, and finally use bright arrows to visually show evacuation directions to fire exits. ConceptDraw is a serious alternative to Visio. It's a desktop based solution aimed at professional designers working in CAD environments. It is also a good option for those who work between Mac and PC because one license is valid for both.
Flow Chart Symbols
The Flowcharts are incredibly useful and popular tool used in science, business, software development, analytics, engineering, marketing, manufacturing, administration, architecture, government, politics, and many other fields thanks to a variety of existing types of flowcharts. A Flowchart is a visual graphical representation of the process, algorithm, or the set of steps taken for problem's solution. Widely used for designing, visualizing and documenting simple and complex processes and programs, they effectively help to understand the process and to find easier the flaws if they are. Each flowchart type supposes the use of its own set of notations for drawing corresponding diagram, which includes the symbols of process, decision, data, document, data base, termination, initiation processes, processing loops, conditions, etc. It is easily design a Flowchart using the special professional flowchart maker - ConceptDraw PRO diagram software with numerous predesigned flow chart symbols grouped in libraries of Flowcharts solution from ConceptDraw Solution Park.Entity Relationship Diagram Symbols
The semantic modeling method nowadays is successfully applied in database structure design. It is effective method of modeling the data structures, which is based on the meaning of these data. As a tool of semantic modeling, there are used different types of Entity-Relationship Diagrams. Entity Relationship Diagram (ERD) is applied to visually and clearly represent a structure of a business database. The main components of ERDs are: entity, relation and attributes. An entity is a class of similar objects in the model, each entity is depicted in the form of rectangle and has the name expressed by a noun. Relation is shown in the form of non-directional line that connects two entities. There are several notation styles used for ERDs: information engineering style, Chen style, Bachman style, Martin Style. The Entity Relationship Diagram symbols used for professional ERD drawing are predesigned by professionals and collected in the libraries of the Entity-Relationship Diagram (ERD) solution for ConceptDraw PRO software.Business Process Flowchart Symbols
Business process modeling is known in the corporate world as an excellent tool which can speak. Business process flowcharts, diagrams and maps are used to define the business processes in terms of inputs and outputs, to visually represent and effectively explain complex business processes of an enterprise, and also showcase decisions on a single piece of paper. The process of business process mapping supposes the use of special business process flowchart symbols predefined by Business Process Modeling Notation (BPMN) and taking their roots from the data processing diagrams and programming flow charts. In other words the BPMN standard notation is a common language used for business process design and implementation, that guarantees a clarity of designed Business Process Flowcharts for all business analysts, technical developers and business managers. The ability to create professionally-looking Business Process flowcharts, maps and diagrams, is provided by powerful ConceptDraw PRO software and the Business Process Mapping solution included to ConceptDraw Solution Park.The vector stencils library "Management indicators" contains 14 visual indicators.
Use it to create your management infogram in the ConceptDraw PRO diagramming and vector drawing software.
The example "Management indicators - Vector stencils library" is included in the solution "Marketing infographics" from the "Business infographics" area of ConceptDraw Solution Park.
Use it to create your management infogram in the ConceptDraw PRO diagramming and vector drawing software.
The example "Management indicators - Vector stencils library" is included in the solution "Marketing infographics" from the "Business infographics" area of ConceptDraw Solution Park.
IDEF3 Standard
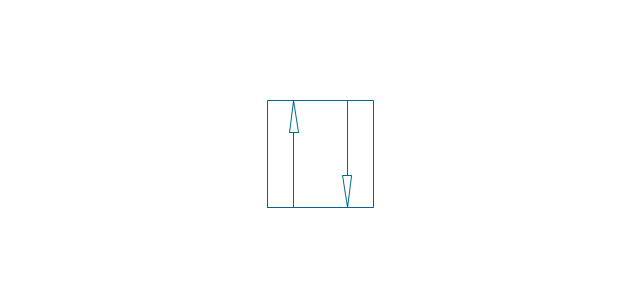
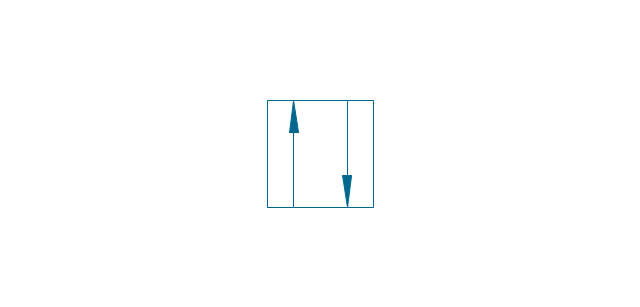
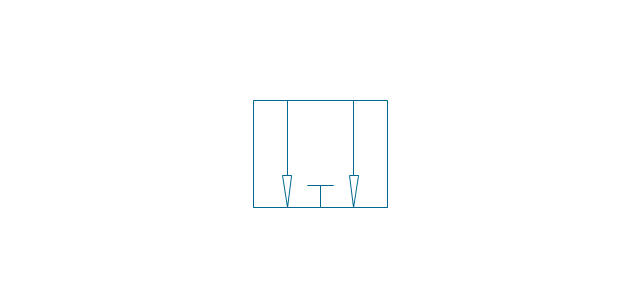
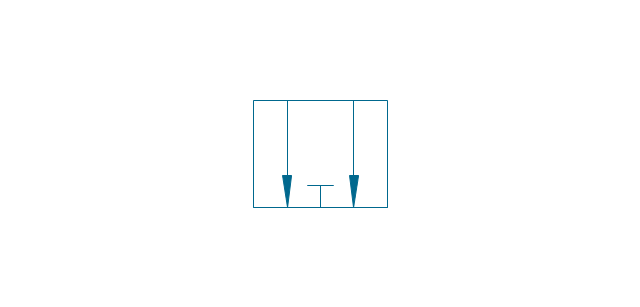
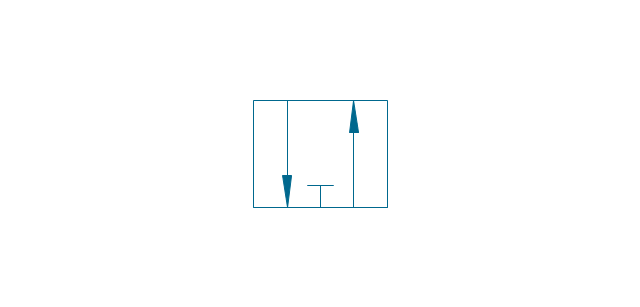
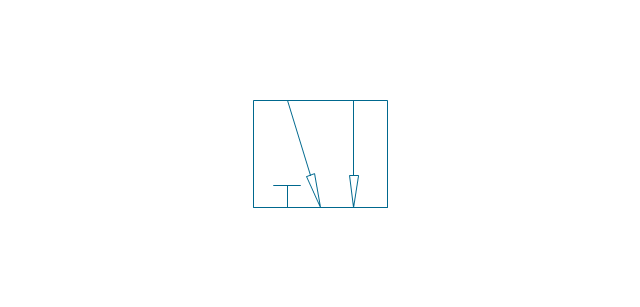
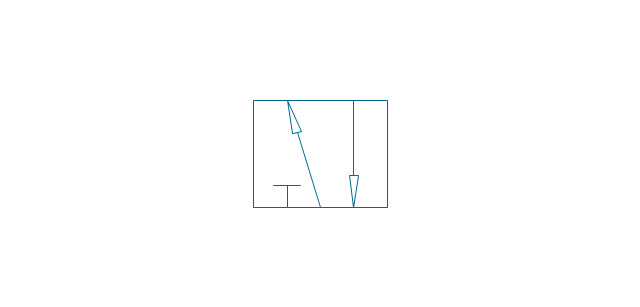
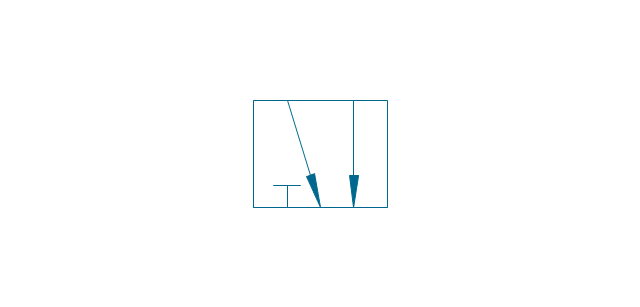
Use Case Diagrams technology. IDEF3 Standard is intended for description and further analysis of technological processes of an enterprise. Using IDEF3 standard it is possible to examine and model scenarios of technological processes.The vector stencils library "Valve assembly" contains 141 symbols of pressure and flow regulators, flow direction indicators, controls, and symbols to design flow paths of control valves in fluid power systems.
Use these valve assembly shapes to design the engineering drawings of hydraulic and pneumatic valve assemblies
in the ConceptDraw PRO diagramming and vector drawing software extended with the Mechanical Engineering solution from the Engineering area of ConceptDraw Solution Park.
www.conceptdraw.com/ solution-park/ engineering-mechanical
 Comparison Dashboard
Comparison dashboard solution extends ConceptDraw PRO software with samples, templates and vector stencils library with charts and indicators for drawing the visual dashboard comparing data.
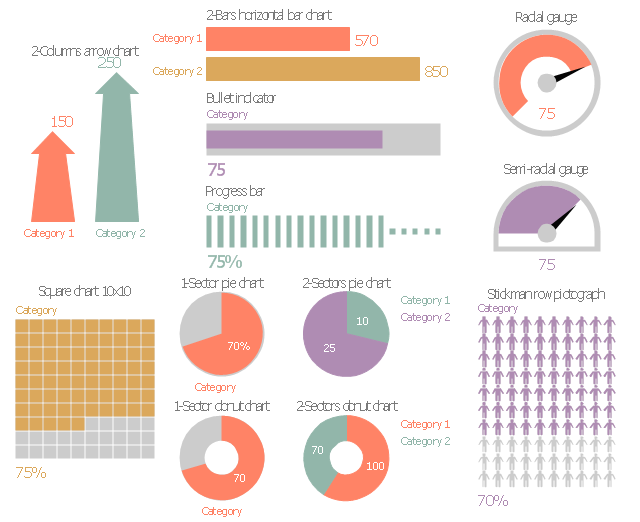
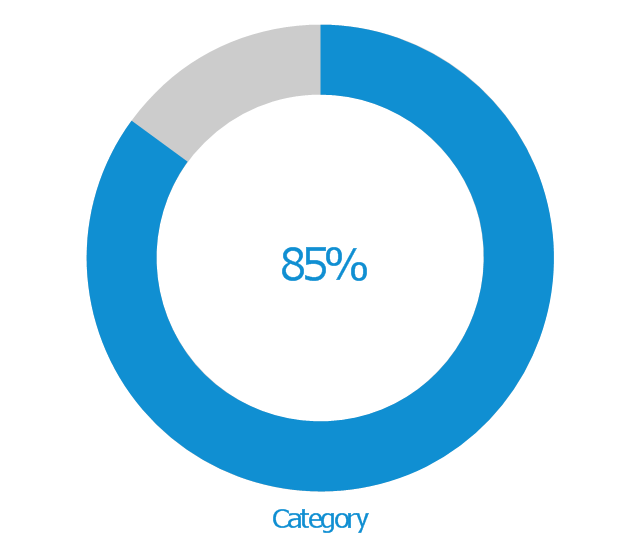
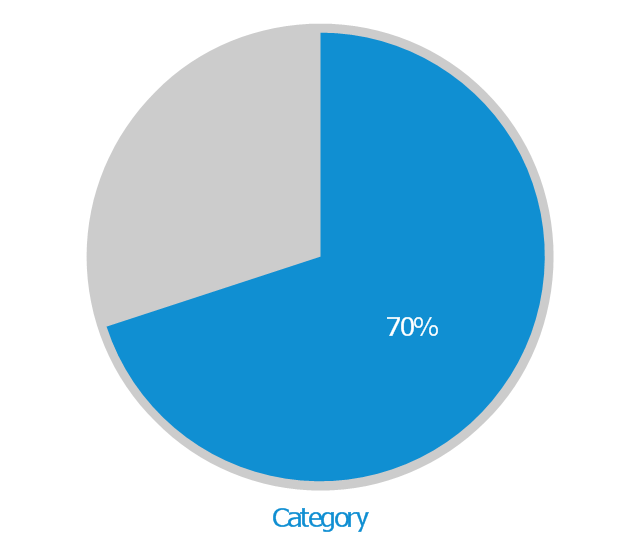
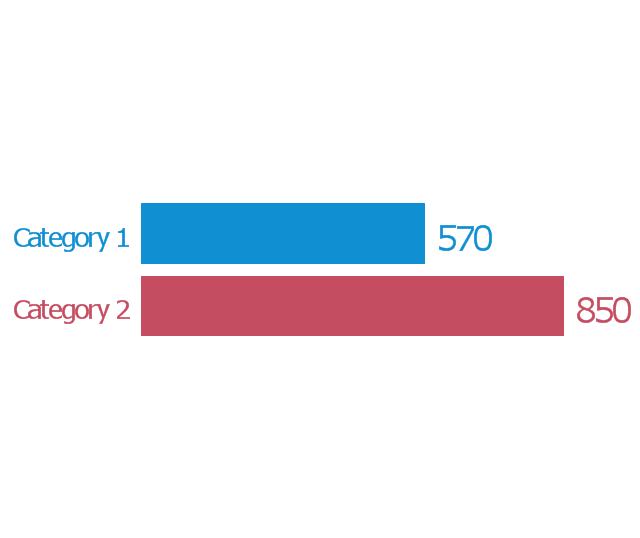
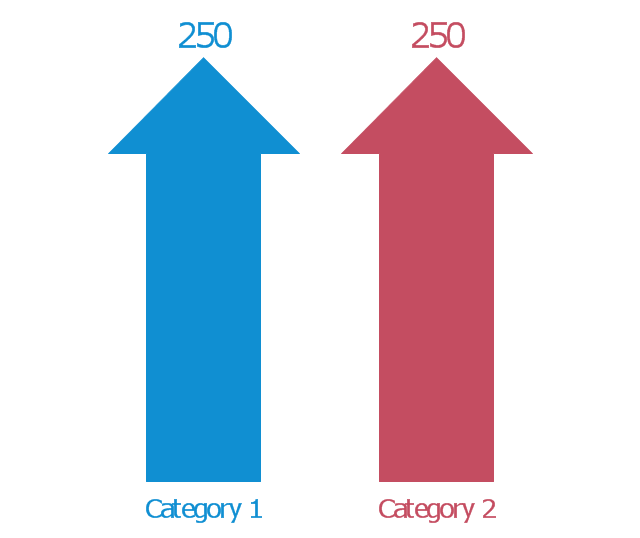
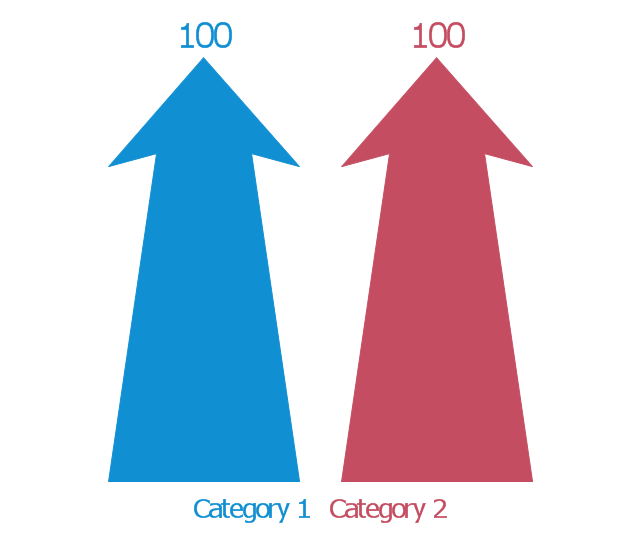
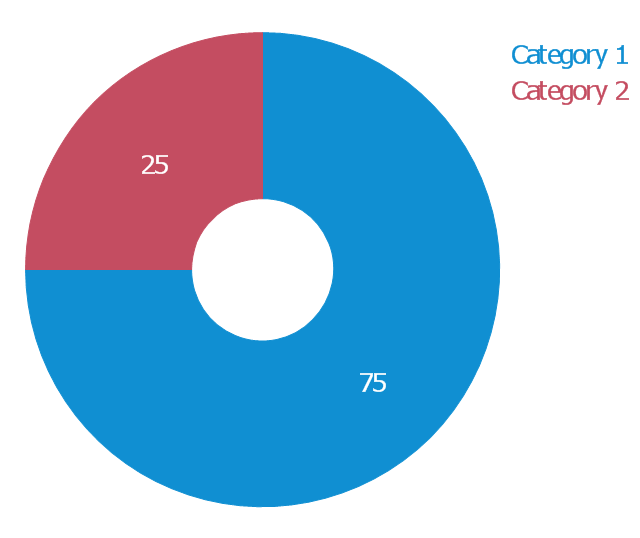
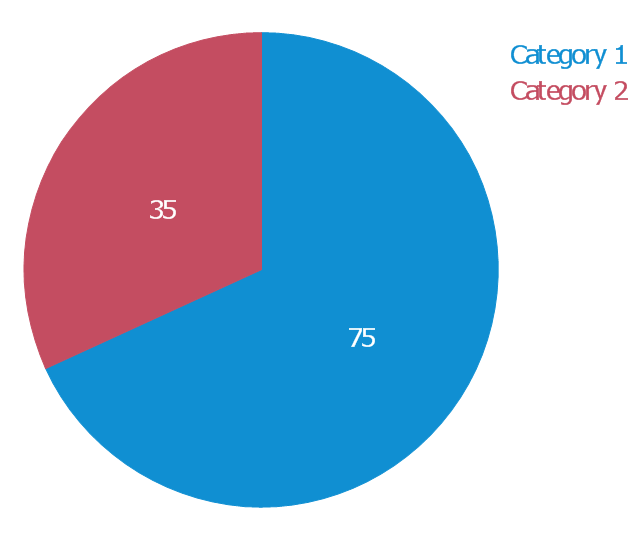
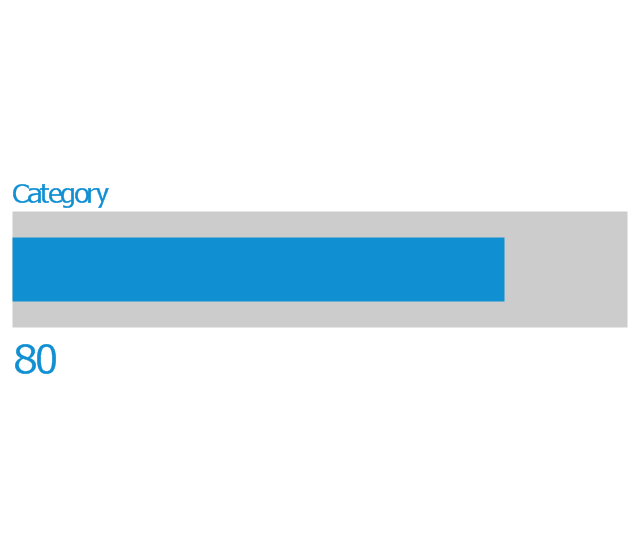
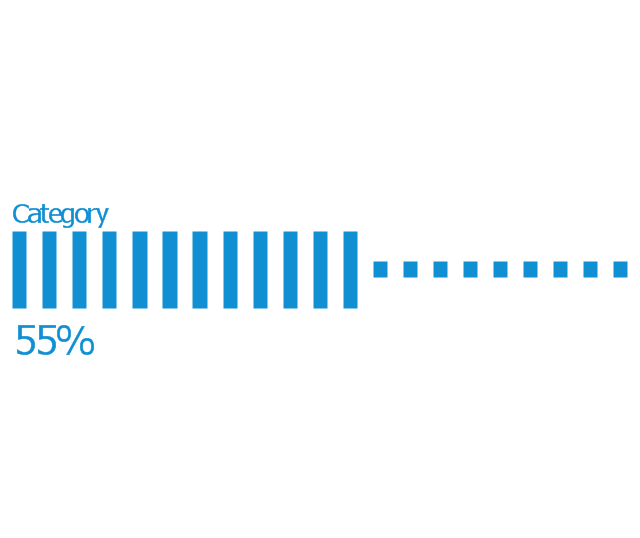
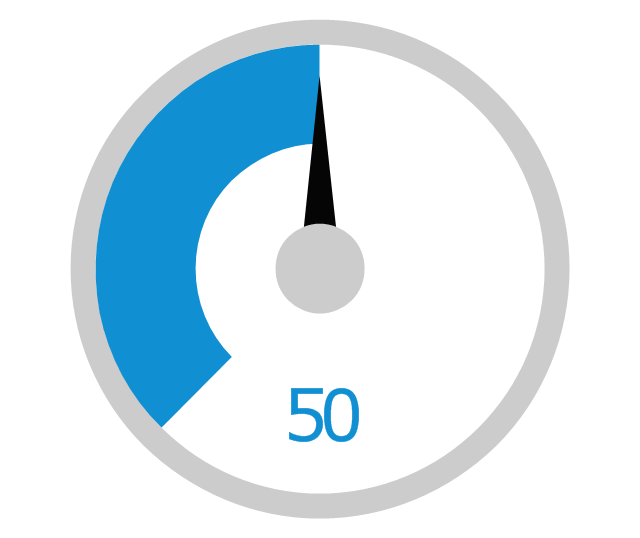
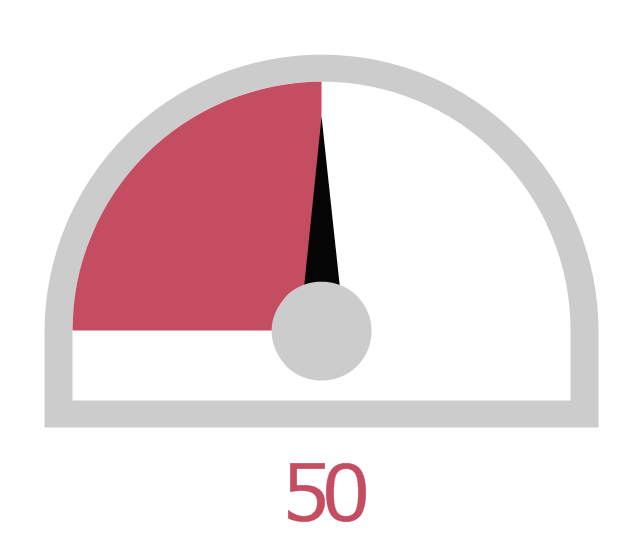
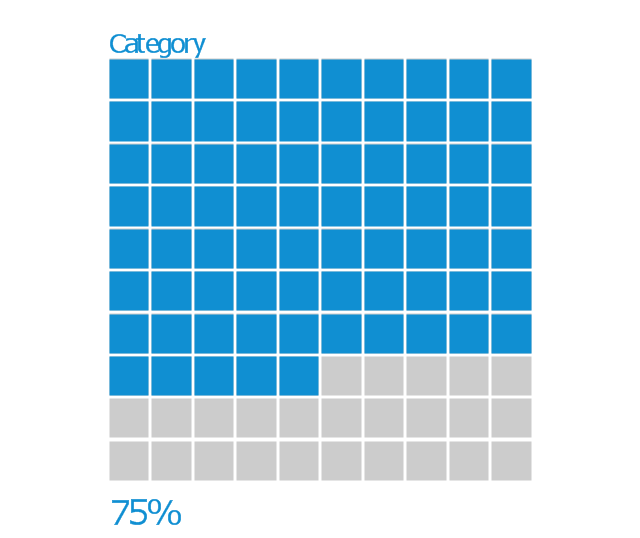
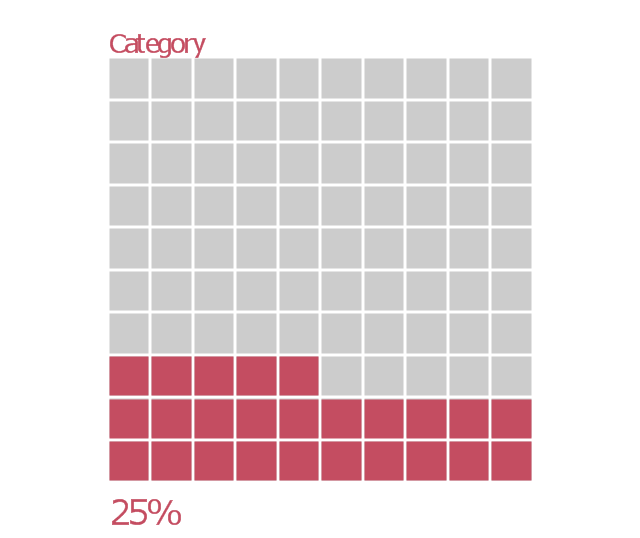
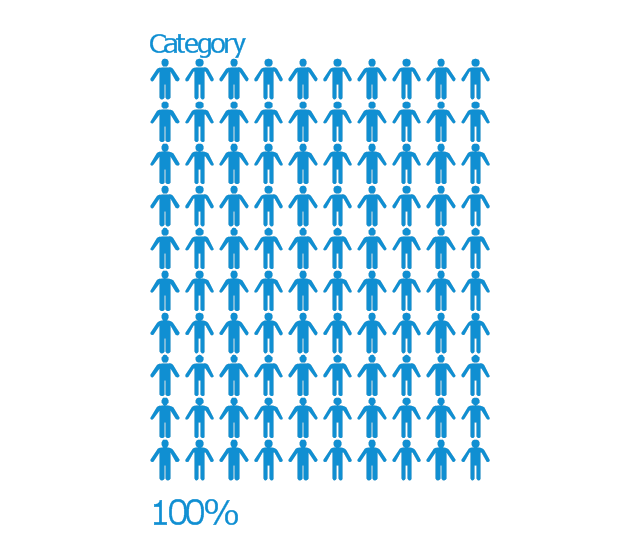
The vector stencils library "Marketing indicators" contains 12 graphic indicators: horizontal bar chart, pie chart, arrow chart, donut chart, square chart, stickman row pictograph, progress bar, bullet indicator, radial gauge, semi-radial gauge.
Use these visual indicators to design your marketing infograms.
The shapes example "Design elements - Marketing indicators" was created using the ConceptDraw PRO diagramming and vector drawing software extended with the Marketing Infographics solition from the area "Business Infographics" in ConceptDraw Solution Park.
- Two Sided Arrow Png
- Two Connected Arrows Pointing Towards Opposite Directions Icon ...
- Two Sided Arow Png
- Two Interchanging Arrow Png
- HR arrows - Vector stencils library | Cruve Arrow Icon Png
- Double Side Arrow Png
- Rounded Arrow Png
- Visio Two Way Arrow
- Arrows - Vector clipart library | Arching Double Sided Arrow Icon
- Two Way Arrow Flowchart




-valve-assembly---vector-stencils-library.png--diagram-flowchart-example.png)
-valve-assembly---vector-stencils-library.png--diagram-flowchart-example.png)
-valve-assembly---vector-stencils-library.png--diagram-flowchart-example.png)
-valve-assembly---vector-stencils-library.png--diagram-flowchart-example.png)
-valve-assembly---vector-stencils-library.png--diagram-flowchart-example.png)
-valve-assembly---vector-stencils-library.png--diagram-flowchart-example.png)
-valve-assembly---vector-stencils-library.png--diagram-flowchart-example.png)
-valve-assembly---vector-stencils-library.png--diagram-flowchart-example.png)
-valve-assembly---vector-stencils-library.png--diagram-flowchart-example.png)
-valve-assembly---vector-stencils-library.png--diagram-flowchart-example.png)
-valve-assembly---vector-stencils-library.png--diagram-flowchart-example.png)
-valve-assembly---vector-stencils-library.png--diagram-flowchart-example.png)
-valve-assembly---vector-stencils-library.png--diagram-flowchart-example.png)
-valve-assembly---vector-stencils-library.png--diagram-flowchart-example.png)
-valve-assembly---vector-stencils-library.png--diagram-flowchart-example.png)
-valve-assembly---vector-stencils-library.png--diagram-flowchart-example.png)
-valve-assembly---vector-stencils-library.png--diagram-flowchart-example.png)
-valve-assembly---vector-stencils-library.png--diagram-flowchart-example.png)
-valve-assembly---vector-stencils-library.png--diagram-flowchart-example.png)
-valve-assembly---vector-stencils-library.png--diagram-flowchart-example.png)
-valve-assembly---vector-stencils-library.png--diagram-flowchart-example.png)
-valve-assembly---vector-stencils-library.png--diagram-flowchart-example.png)
-valve-assembly---vector-stencils-library.png--diagram-flowchart-example.png)
-valve-assembly---vector-stencils-library.png--diagram-flowchart-example.png)

































-valve-assembly---vector-stencils-library.png--diagram-flowchart-example.png)

-valve-assembly---vector-stencils-library.png--diagram-flowchart-example.png)













-valve-assembly---vector-stencils-library.png--diagram-flowchart-example.png)
-valve-assembly---vector-stencils-library.png--diagram-flowchart-example.png)


-valve-assembly---vector-stencils-library.png--diagram-flowchart-example.png)

