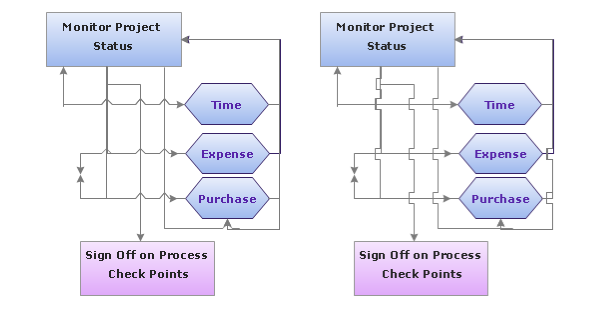
IDEF3 Standard
Use Case Diagrams technology. IDEF3 Standard is intended for description and further analysis of technological processes of an enterprise. Using IDEF3 standard it is possible to examine and model scenarios of technological processes.
 Venn Diagrams
Venn Diagrams are actively used to illustrate simple set relationships in set theory and probability theory, logic and statistics, mathematics and computer science, linguistics, sociology, and marketing. Venn Diagrams are also often used to visually summarize the status and future viability of a project.
 Education Package
Education Package is a comprehensive set of multifarious graphical solutions from ConceptDraw Solution Park, collected together in help to ConceptDraw PRO users working in a field of science, education and training, which is aimed at improving the quality of education and helping to design with ease variety of interesting and colorful educational materials, diagrams, charts and maps. Use it to present the information and knowledge in an interesting, clear, structured and simple form to achieve a success in education and pedagogy, to maintain the interest of students and pupils throughout the whole learning process, at the lectures, lessons and even during independent work with additional materials, to contribute to better perception of scientific information by listeners during the conferences and reports.
 Comparison Dashboard
Comparison dashboard solution extends ConceptDraw PRO software with samples, templates and vector stencils library with charts and indicators for drawing the visual dashboard comparing data.
HelpDesk
How to Set Line Jumps for Smart Connectors in ConceptDraw PRO
Connecting objects in ConceptDraw PRO is an easy task. You can use Chain, or Tree connection mode for automatic connection of multiple objects. Besides the automatic connection modes, ConceptDraw PRO offers few options to connect objects manually: Direct, Arc, Bezier, Smart, Curve and Round Connectors. You can make them square, arched or angled and also set vertical or horizontal orientation Thus, you can control how the jumps and orientation occurs on smart connectors. When two smart connectors cross each other you can control how the two intersecting lines look.HelpDesk
How to Draw the Different Types of Pie Charts
Using the Pie Chart, you can visually estimate the relative contribution that different data categories contribute to a whole value. The pie chart displays the statistics in a visual format. The main use of pie charts to show comparisons. The larger piece of the pie, the more the value of this value compared to the rest. Various applications of pie charts can be found in business and education. For business, pie charts can be used to compare the success or failure of the goods or services. They may also be used to display the business market share.- Basic Flowchart Symbols and Meaning | Arrow circle chart ...
- 2 Circle Venn Diagram. Venn Diagram Example | Venn Diagram | 3 ...
- Vector Arrow Circle
- Arrow circle chart - Template | Circular Flow Diagram Template ...
- How to Draw a Circular Arrows Diagram Using ConceptDraw PRO ...
- 5 Arrow Circle Vector Ppt
- Circle Spoke Diagram Template | Best Diagramming | Pie Chart ...
- Double Ended Arrow
- Pie Chart Examples and Templates | Pie Charts | Arrow circle chart ...
- Circle Arrow Diagram Template
- Arrow circle chart - Template | Circular diagrams - Vector stencils ...
- Circle Arrow Diagram
- Basic Flowchart Symbols and Meaning | Venn Diagram | 2 Circle ...
- How to Draw a Circular Arrows Diagram Using ConceptDraw PRO
- Circle Arrow Diagram Powerpoint Free
- Graph With Two Circles
- Circular arrows diagrams - Vector stencils library | Pie Chart ...
- Circle Arrow Graph
- Basic Flowchart Symbols and Meaning | Circular arrows diagrams ...
- Circular Flow Diagram Template | Circular Arrow | Circular Arrows ...


