Bubble diagrams in Landscape Design with ConceptDraw DIAGRAM
Bubble Diagrams are the charts with a bubble presentation of data with obligatory consideration of bubble's sizes. They are analogs of Mind Maps and find their application at many fields, and even in landscape design. At this case the bubbles are applied to illustrate the arrangement of different areas of future landscape design, such as lawns, flowerbeds, playgrounds, pools, recreation areas, etc. Bubble Diagram helps to see instantly the whole project, it is easy for design and quite informative, in most cases it reflects all needed information. Often Bubble Diagram is used as a draft for the future landscape project, on the first stage of its design, and in case of approval of chosen design concept is created advanced detailed landscape plan with specification of plants and used materials. Creation of Bubble Diagrams for landscape in ConceptDraw DIAGRAM software is an easy task thanks to the Bubble Diagrams solution from "Diagrams" area. You can use the ready scanned location plan as the base or create it easy using the special ConceptDraw libraries and templates.HelpDesk
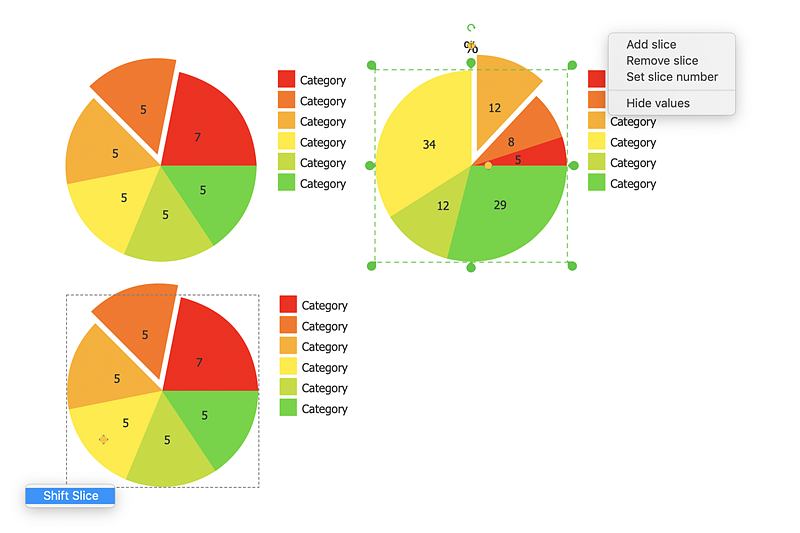
How to Draw the Different Types of Pie Charts
Using the Pie Chart, you can visually estimate the relative contribution that different data categories contribute to a whole value. The pie chart displays the statistics in a visual format. The main use of pie charts to show comparisons. The larger piece of the pie, the more the value of this value compared to the rest. Various applications of pie charts can be found in business and education. For business, pie charts can be used to compare the success or failure of the goods or services. They may also be used to display the business market share.HelpDesk
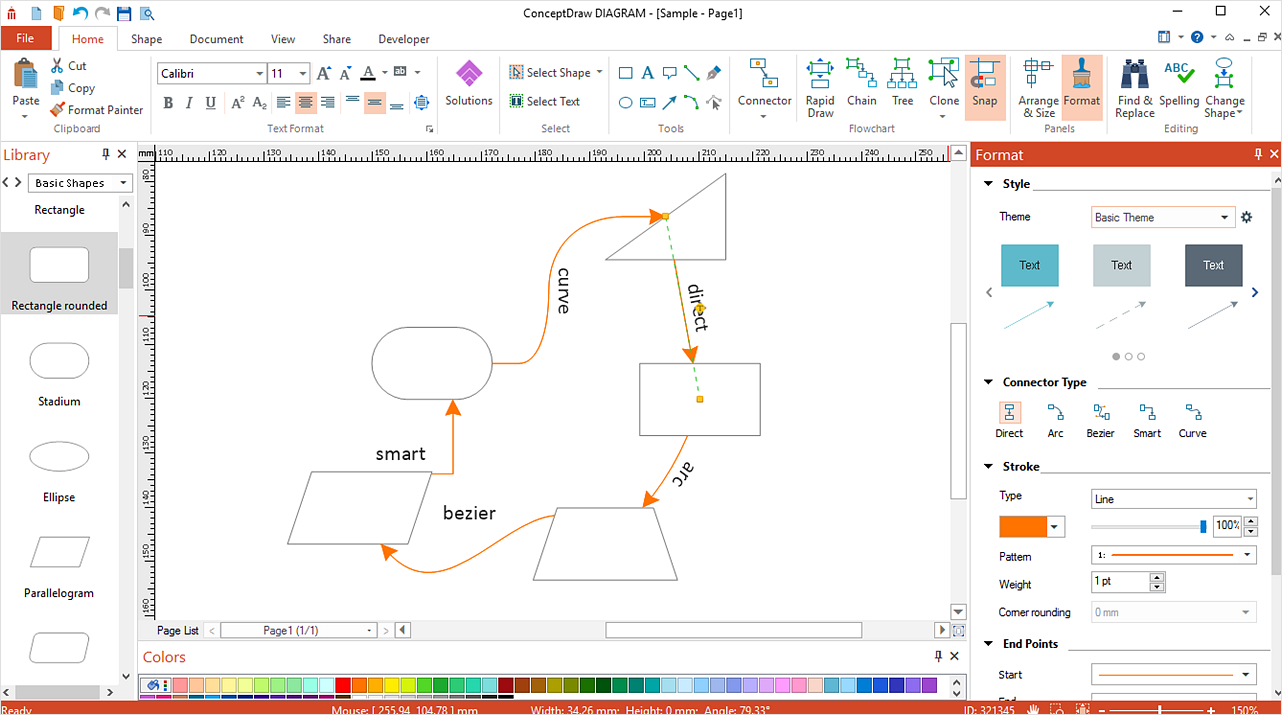
How to Connect Objects on PC
ConceptDraw DIAGRAM provides a few options for drawing connections between objects: Direct Connectors, Smart, Arc, Bezier, Curve and Round Connectors. You can connect objects in your ConceptDraw diagram with proper connectors using the embedded automatic connection modes. This article describes how you can connect objects with connectors and how you can ascribe different types and behaviors.IDEF3 Standard
Use Case Diagrams technology. IDEF3 Standard is intended for description and further analysis of technological processes of an enterprise. Using IDEF3 standard it is possible to examine and model scenarios of technological processes.
 Computer Network Diagrams
Computer Network Diagrams solution extends ConceptDraw DIAGRAM software with samples, templates and libraries of vector icons and objects of computer network devices and network components to help you create professional-looking Computer Network Diagrams, to plan simple home networks and complex computer network configurations for large buildings, to represent their schemes in a comprehensible graphical view, to document computer networks configurations, to depict the interactions between network's components, the used protocols and topologies, to represent physical and logical network structures, to compare visually different topologies and to depict their combinations, to represent in details the network structure with help of schemes, to study and analyze the network configurations, to communicate effectively to engineers, stakeholders and end-users, to track network working and troubleshoot, if necessary.
 Network Layout Floor Plans
Network Layout Floor Plans solution extends ConceptDraw DIAGRAM software functionality with powerful tools for quick and efficient documentation the network equipment and displaying its location on the professionally designed Network Layout Floor Plans. Never before creation of Network Layout Floor Plans, Network Communication Plans, Network Topologies Plans and Network Topology Maps was not so easy, convenient and fast as with predesigned templates, samples, examples and comprehensive set of vector design elements included to the Network Layout Floor Plans solution. All listed types of plans will be a good support for the future correct cabling and installation of network equipment.
HelpDesk
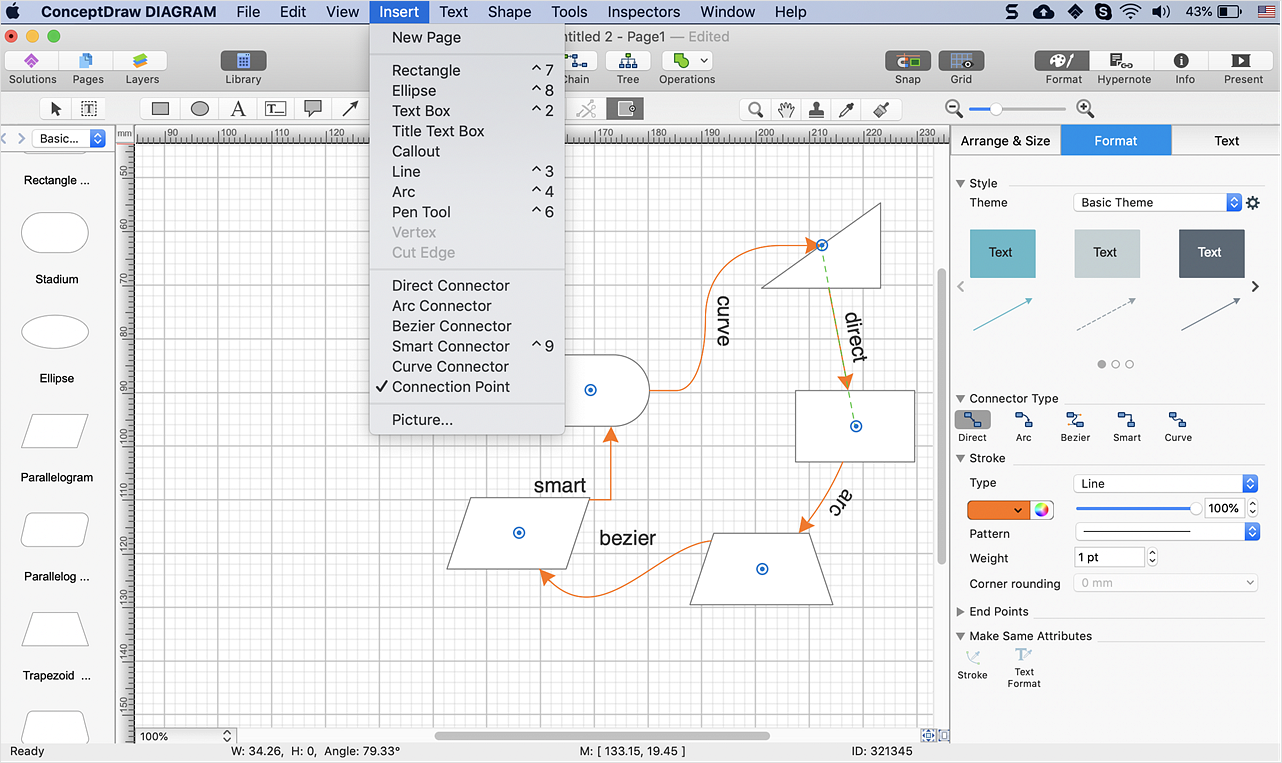
How to Connect Objects on Mac
ConceptDraw DIAGRAM provides a few options for drawing connections between. This article describes how you can connect objects with connectors and how you can ascribe them different types and behaviors.- Basic Flowchart Symbols and Meaning | Process Flowchart | Types ...
- Arrow Round And Around Graphics
- Campus Area Networks (CAN). Computer and Network Examples ...
- Computer Arrow Symbols
- Types Of Connectors In Computer
- Types of Flowcharts | Types of Flowchart - Overview | Basic ...
- Types Of Computer Connectors
- Block diagram - Types of individual behavior in organization ...
- Process Flowchart | IDEF0 Flowchart Symbols | Types of Flowcharts ...
- How to Draw a Circular Arrows Diagram Using ConceptDraw PRO ...
- Basic Flowchart Symbols and Meaning | Process Flowchart | Types ...
- Flowchart Definition | Types of Flowcharts | IDEF0 Flowchart ...
- A Flowchart Of How To Turn On The Computer
- Basic Flowchart Symbols and Meaning | Process Flowchart | Types ...
- Types of Flowcharts | Material Requisition Flowchart. Flowchart ...
- Process Flowchart | Types of Flowcharts | IDEF0 Diagram | Flow ...
- Activity on Node Network Diagramming Tool | Network Analysis ...
- Basic Flowchart Symbols and Meaning | Process Flowchart | Types ...
- Types of Flowcharts | Types of Flowchart - Overview | Basic ...
- Network Topologies | Hotel Network Topology Diagram | Computer ...


