Bubble diagrams in Landscape Design with ConceptDraw DIAGRAM
Bubble Diagrams are the charts with a bubble presentation of data with obligatory consideration of bubble's sizes. They are analogs of Mind Maps and find their application at many fields, and even in landscape design. At this case the bubbles are applied to illustrate the arrangement of different areas of future landscape design, such as lawns, flowerbeds, playgrounds, pools, recreation areas, etc. Bubble Diagram helps to see instantly the whole project, it is easy for design and quite informative, in most cases it reflects all needed information. Often Bubble Diagram is used as a draft for the future landscape project, on the first stage of its design, and in case of approval of chosen design concept is created advanced detailed landscape plan with specification of plants and used materials. Creation of Bubble Diagrams for landscape in ConceptDraw DIAGRAM software is an easy task thanks to the Bubble Diagrams solution from "Diagrams" area. You can use the ready scanned location plan as the base or create it easy using the special ConceptDraw libraries and templates.Use Case Diagrams technology with ConceptDraw DIAGRAM
Use case diagrams are used at the development of software and systems for definition of functional system requirements or system of systems. Use case diagram presents the consecution of object’s actions (user’s or system’s) which are executed for reaching the definite result.
 Seating Plans
The Seating Plans solution including samples, seating chart templates and libraries of vector design elements assists in creating the Seating plans, Seating arrangement charts, Chair layout designs, Plan drawings of cinema seating, Movie theater chair plans, extensive Cinema theater plans depicting the seating arrangement in the cinema halls, location of closet, cafe and food sale area, in designing the Seating plans for the large seating areas, Seat plan designs for airplanes, trains, etc. Use any of the included samples as the table seating chart template or seating chart template free and achieve professional drawing results in a few minutes.
 Computer Network Diagrams
Computer Network Diagrams solution extends ConceptDraw DIAGRAM software with samples, templates and libraries of vector icons and objects of computer network devices and network components to help you create professional-looking Computer Network Diagrams, to plan simple home networks and complex computer network configurations for large buildings, to represent their schemes in a comprehensible graphical view, to document computer networks configurations, to depict the interactions between network's components, the used protocols and topologies, to represent physical and logical network structures, to compare visually different topologies and to depict their combinations, to represent in details the network structure with help of schemes, to study and analyze the network configurations, to communicate effectively to engineers, stakeholders and end-users, to track network working and troubleshoot, if necessary.
HelpDesk
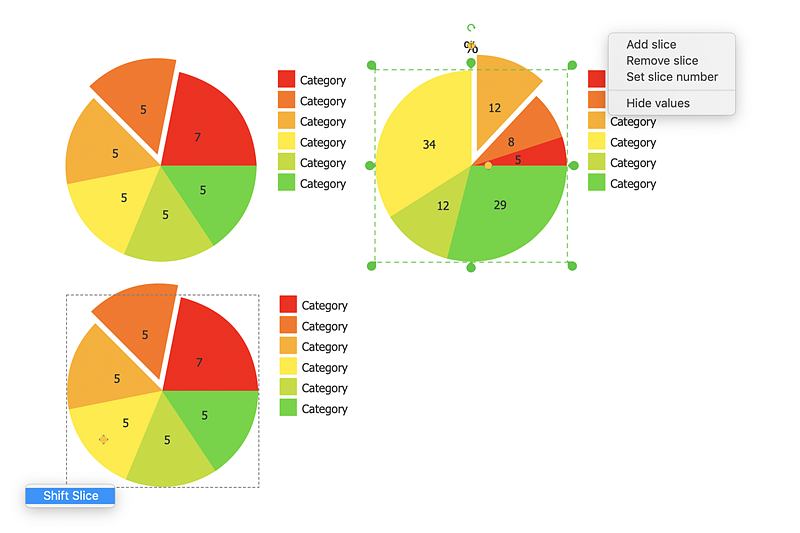
How to Draw the Different Types of Pie Charts
Using the Pie Chart, you can visually estimate the relative contribution that different data categories contribute to a whole value. The pie chart displays the statistics in a visual format. The main use of pie charts to show comparisons. The larger piece of the pie, the more the value of this value compared to the rest. Various applications of pie charts can be found in business and education. For business, pie charts can be used to compare the success or failure of the goods or services. They may also be used to display the business market share.- Common joint types | Polygon types | Bubble diagrams in ...
- Enterprise Architecture Diagrams | Types of Flowchart - Overview ...
- UML Diagram Types List
- Bubble diagrams in Landscape Design with ConceptDraw PRO
- Bubble diagrams in Landscape Design with ConceptDraw PRO ...
- UML Diagram | Network diagrams with ConceptDraw PRO | Bubble ...
- How to Draw a Bubble Chart | How To Create a Bubble Chart | How ...
- Sentence Diagram | Language Learning | Bubble diagrams in ...
- Data structure diagram with ConceptDraw PRO | Express-G ...
- Basic Flowchart Symbols and Meaning | Process Flowchart | Bubble ...
- How To Make a Bubble Chart | How To Create a Bubble Chart | How ...
- Data structure diagram with ConceptDraw PRO | Bubble diagrams in ...
- Bubble diagrams in Landscape Design with ConceptDraw PRO ...
- McKinsey 7S framework - Bubble diagram | Websites interlinking to ...
- How To Make a Bubble Chart | How To Create a Bubble Chart | How ...
- Best Diagramming Software for Mac | Flow chart Example ...
- Design elements - Bubble diagrams | How to Create a Bubble ...
- How To Create a Bubble Chart | Best Diagramming Software for Mac ...
- Best Diagramming Software for Mac | Bubble Diagrams | UML ...
- Bubble diagrams in Landscape Design with ConceptDraw PRO ...


