Bar Chart Examples
Complete set of bar chart examples is produced using ConceptDraw software. Surfing bar chart examples you can find an example that is the best for your case.Bar Graph
You need to draw the Bar Graph? The automated tool can be useful for you. ConceptDraw DIAGRAM diagramming and vector drawing software extended with Bar Graphs solution from Graphs and Charts area of ConceptDraw Solution Park will help you create any Bar Graph.Bar Chart Software
The best bar chart software ever is ConceptDraw. ConceptDraw bar chart software provides an interactive bar charting tool and complete set of predesigned bar chart objects.Pie Chart Software
A pie chart is a circular diagram showing a set of data divided into proportional slices. There are several variations of this chart such as donut chart, exploded pie chart, multi-level pie charts. Although it is not very informative when a ring chart or circle chart has many sections, so choosing a low number of data points is quite important for a useful pie chart. ConceptDraw DIAGRAM software with Pie Charts solution helps to create pie and donut charts for effective displaying proportions in statistics, business and mass media for composition comparison, i.e. for visualization of part percentage inside one total.Picture Graph
A Picture Graph is a popular and widely used type of a bar graph, which represents data in various categories using the pictures. ConceptDraw DIAGRAM extended with Picture Graphs solution from the Graphs and Charts area of ConceptDraw Solution Park is the best software for fast and simple drawing professional looking Picture Graphs.Pie Chart Software
A pie chart is a circular diagram showing a set of data divided into proportional slices. There are several variations of this chart such as donut chart, exploded pie chart, multi-level pie charts. Although it is not very informative when a ring chart or circle chart has many sections, so choosing a low number of data points is quite important for a useful pie chart. ConceptDraw DIAGRAM software with Pie Charts solution helps to create pie and donut charts for effective displaying proportions in statistics, business and mass media for composition comparison, i.e. for visualization of part percentage inside one total.Bar Diagrams for Problem Solving. Create event management bar charts with Bar Graphs Solution
Create bar charts for event management problem solving and visual data comparison using the ConceptDraw DIAGRAM diagramming and vector drawing software extended with the Bar Graphs Solution from the Graphs and Charts area of ConceptDraw Solition Park.The Best Drawing Program for Mac
ConceptDraw DIAGRAM is the professional business graphic software for drawing diagrams and charts with great visual appeal on Mac OS X.Project Reports — Visual Reports
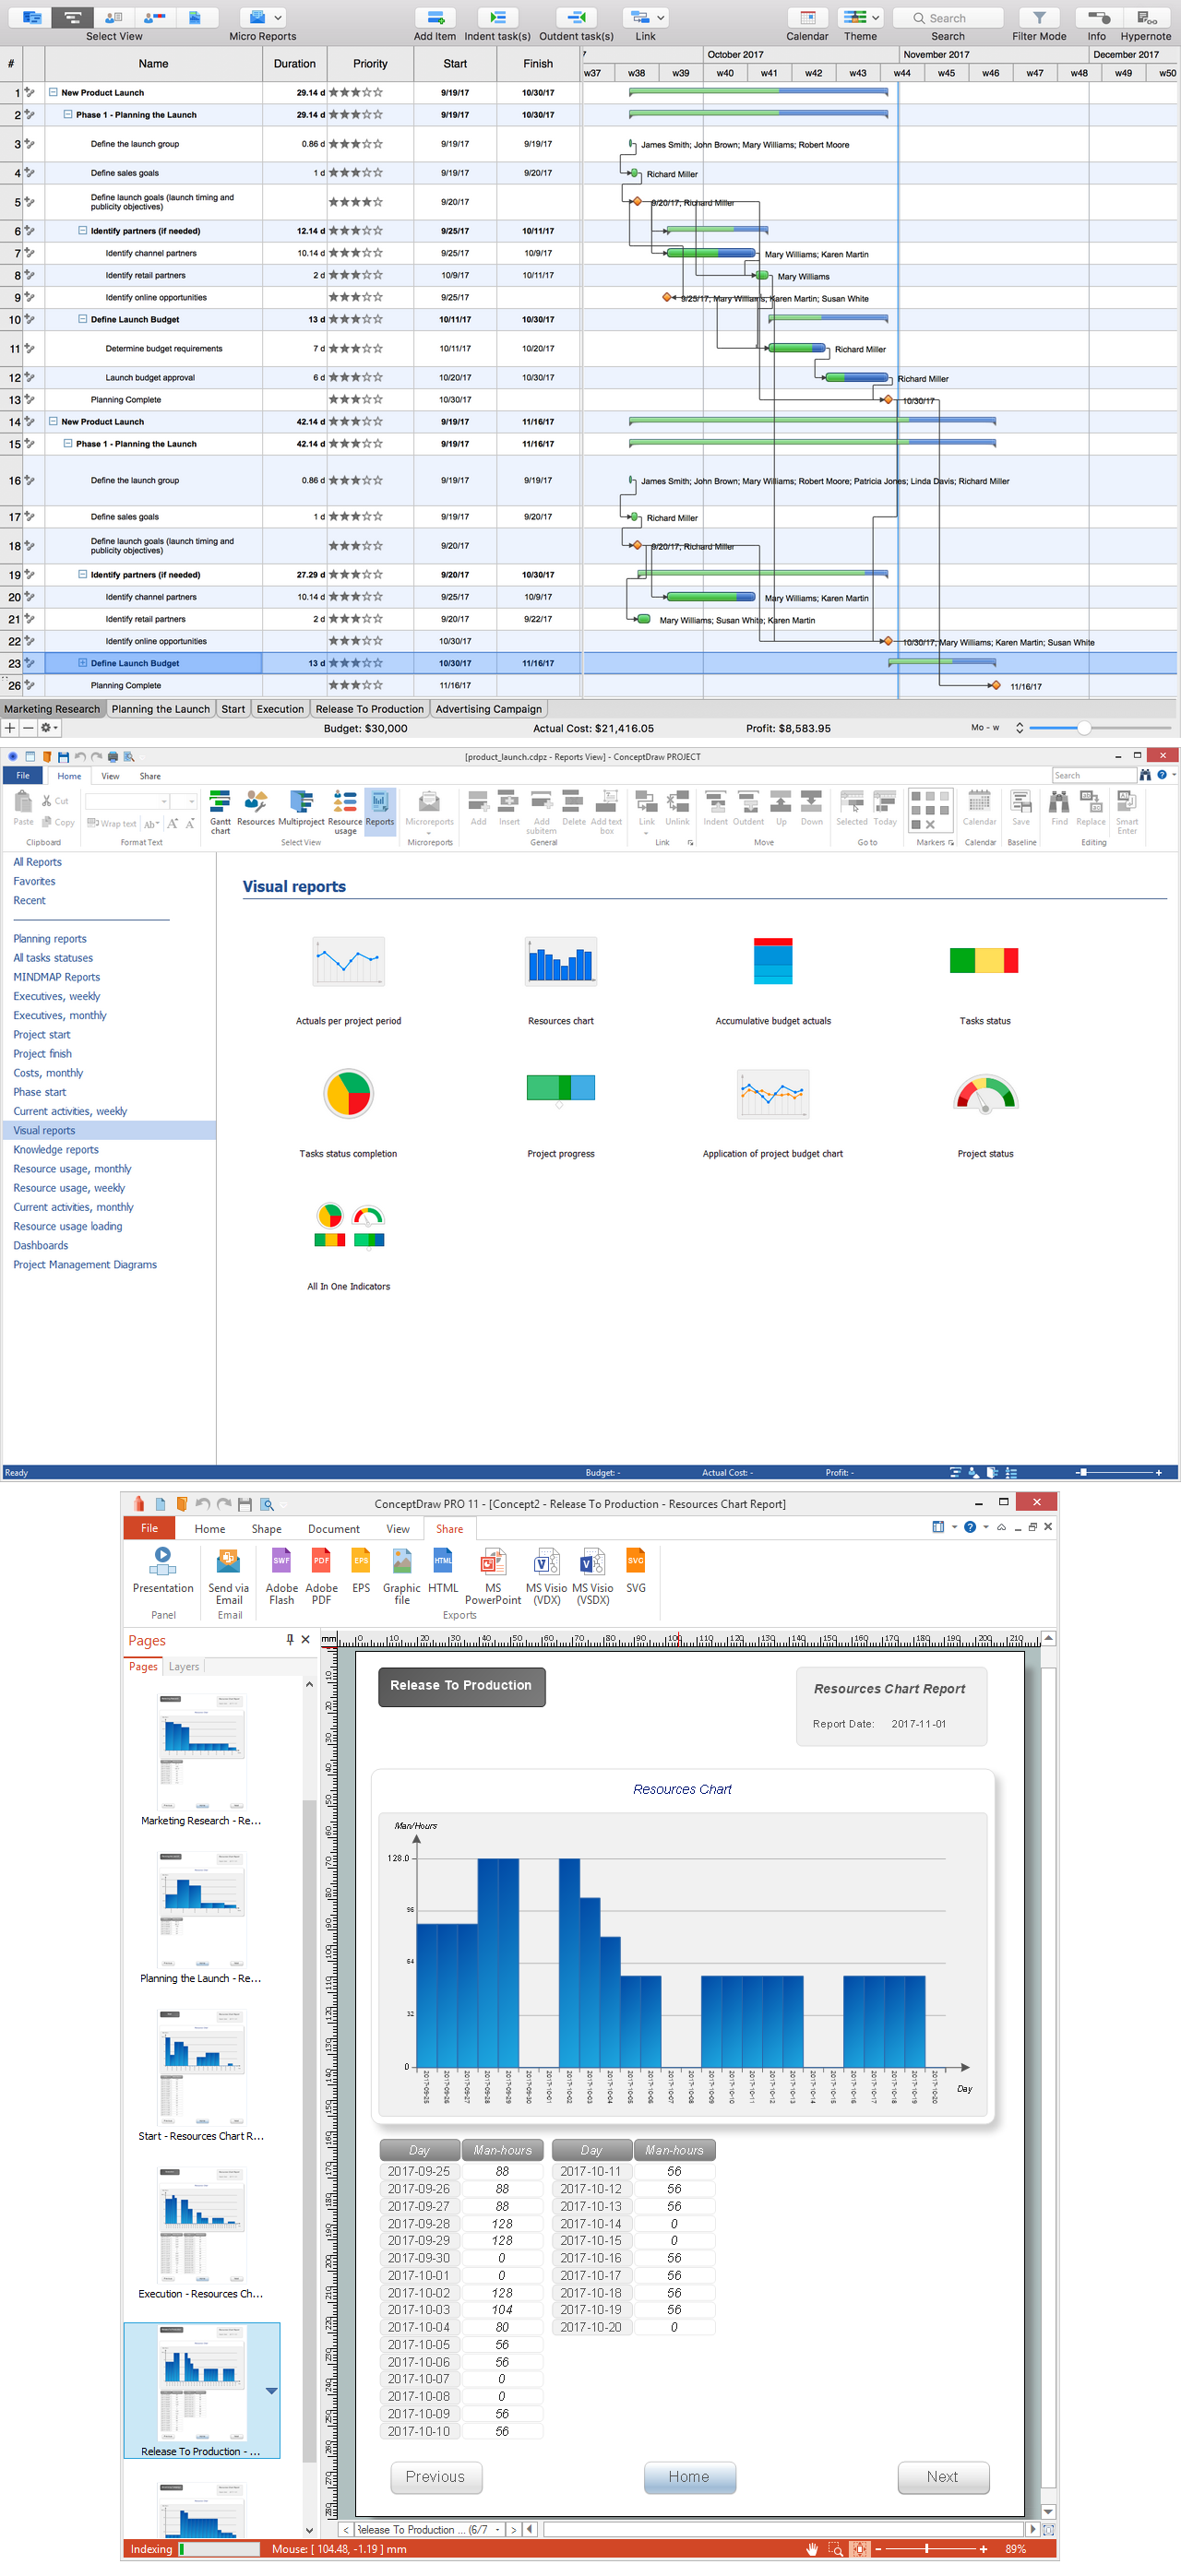
The diagrams and graphs are a clear and illustrative way of representing different information, data, ratios of values forming a single unity. There are many kinds of graphs and charts, which find their application in varied fields and spheres of activity, including the field of project management. For each type of information its own the most suitable visualization tool is used. A visual analysis of diagrams is a simplest, but highly effective planning and project management tool, convenient to obtain the answers to many questions concerning the project and its implementation.Pie Graph Worksheets
Pie Graph is very popular kind of charts which is widely used in various fields of science and life activities. ConceptDraw DIAGRAM extended with Pie Charts Solution from the Graphs and Charts area is the best software for drawing the Pie Graph Worksheets.
 Statistical Charts Area
Statistical Charts Area extends greatly abilities of the ConceptDraw DIAGRAM's users providing a wide variety of high-functional solutions intended for drawing different types of Statistical Charts, such as Area Charts, Bar Graphs, Divided Bar Diagrams, H
 Bar Graphs
The Bar Graphs solution enhances ConceptDraw DIAGRAM functionality with templates, numerous professional-looking samples, and a library of vector stencils for drawing different types of Bar Graphs, such as Simple Bar Graph, Double Bar Graph, Divided Bar Graph, Horizontal Bar Graph, Vertical Bar Graph, and Column Bar Chart.
Column Chart Template
Column chart templates from ConceptDraw collection can help you find the best visual depiction for you data. You can easily modify column chart templates according to data you want to visualize.Basic Diagramming
Block diagrams are essentially a very simple format of diagrams. A variety of commonly used shapes and connecting lines, rules of construction and actions pertaining to them, make Block diagram a versatile and flexible tool for many forms of industry. Another advantage is the ease with which Block diagrams can be constructed, especially if you use professional diagramming software. ConceptDraw DIAGRAM software is an example of purpose built application designed with the form of process modeling in mind. It includes Block Diagrams solution from Diagrams area of ConceptDraw Solution Park for easy drawing professional-looking simple diagram - Block diagram, and a lot of other useful solutions for designing variety of other types of diagrams, schematics and flowcharts (Line graphs, Bar charts, Organizational charts, Histograms, Pie charts, Process flowcharts, Fault tree analysis diagrams, Scatter plots, Venn diagrams, Bubble diagrams, etc.). The RapidDraw functionality of ConceptDraw DIAGRAM lets create new objects and their connectors in just single-click.
 25 Typical Orgcharts
The 25 Typical Orgcharts solution contains powerful organizational structure and organizational management drawing tools, a variety of professionally designed organization chart and matrix organization structure samples, 25 templates based on various orga
Area Charts
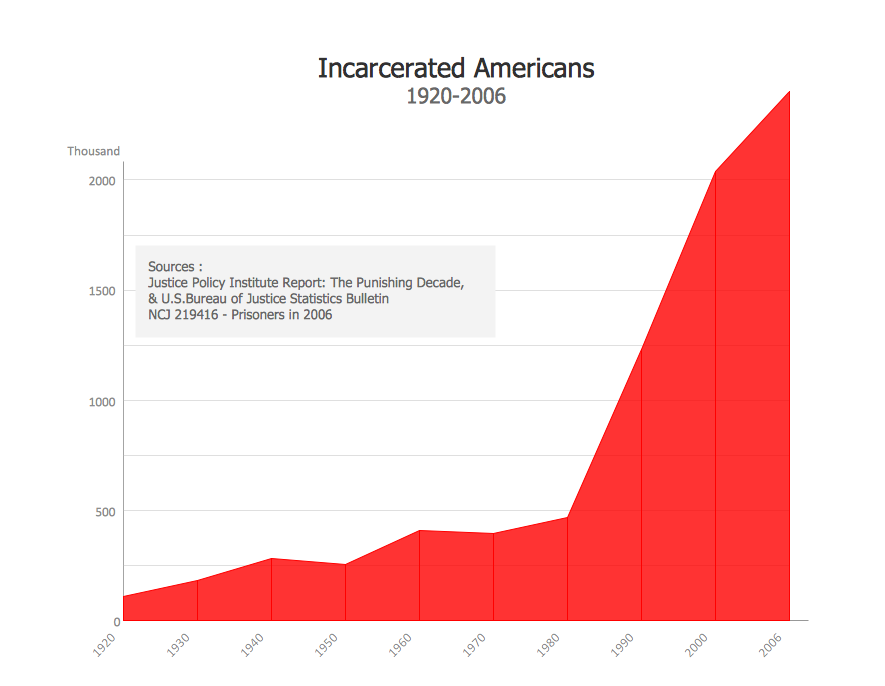
ConceptDraw DIAGRAM diagramming and vector drawing software extended with Area Charts solution from the Graphs and Charts area of ConceptDraw Solution Park is the best for drawing the Area Charts simply and fast.Chart Software for Better Presentations
Easy charting software comes with beautiful chart templates and examples. This makes it easy to create professional charts without prior experience. Graphs and Charts Area provide a wide collection of professional looking predesigned templates, samples and ready-to-use vector stencils that will help you to draw the charts and diagrams of various types: Pie Charts, Donut Charts, Line Charts, Column Charts, Bar Charts, Pyramids, Scatter Charts, Venn Diagrams, Spider Charts, Area Charts, Divided Bar Graphs.Scatter Graph Charting Software
ConceptDraw provides some interactive xy chart and scatter graph symbols that offers advanced features yet is simple to use.- Picture Graph | Picture Graphs | Picture graph - Template | Types Of ...
- How to Draw the Different Types of Pie Charts | Pie Chart Examples ...
- CS Odessa Announces Additions to Powerful Graphs and Charts ...
- Sales Growth. Bar Graphs Example | Bar Diagrams for Problem ...
- Area Charts | Bar Graphs | Design elements - Biochemistry of ...
- Bar Diagrams for Problem Solving. Create space science bar charts ...
- Atmosphere air composition | Percentage Pie Chart. Pie Chart ...
- How to Draw the Different Types of Pie Charts | Pie Chart Software ...
- Sample Marketing Graph
- Basis Or Types Of Departmentalization Supported By Charts
- Types Of Soil Percentage Bar Graph Pictures
- Bar Graphs | Serious crime in Cincinnati | Column Chart Examples ...
- Line Chart Examples | Line Graph | Pictures of Graphs | Population ...
- Design elements - HR department | Types Of Departmentalization ...
- New Basic Pie Charts Solution for ConceptDraw PRO
- Project Reports — Visual Reports
- Percentage Pie Chart. Pie Chart Examples | How to Draw the ...
- How to Draw the Different Types of Pie Charts | Visio Charting ...
- How to Draw the Different Types of Pie Charts | Pie charts - Vector ...
- Basic Diagramming | Line Graph | Area Chart | Population Flow ...


