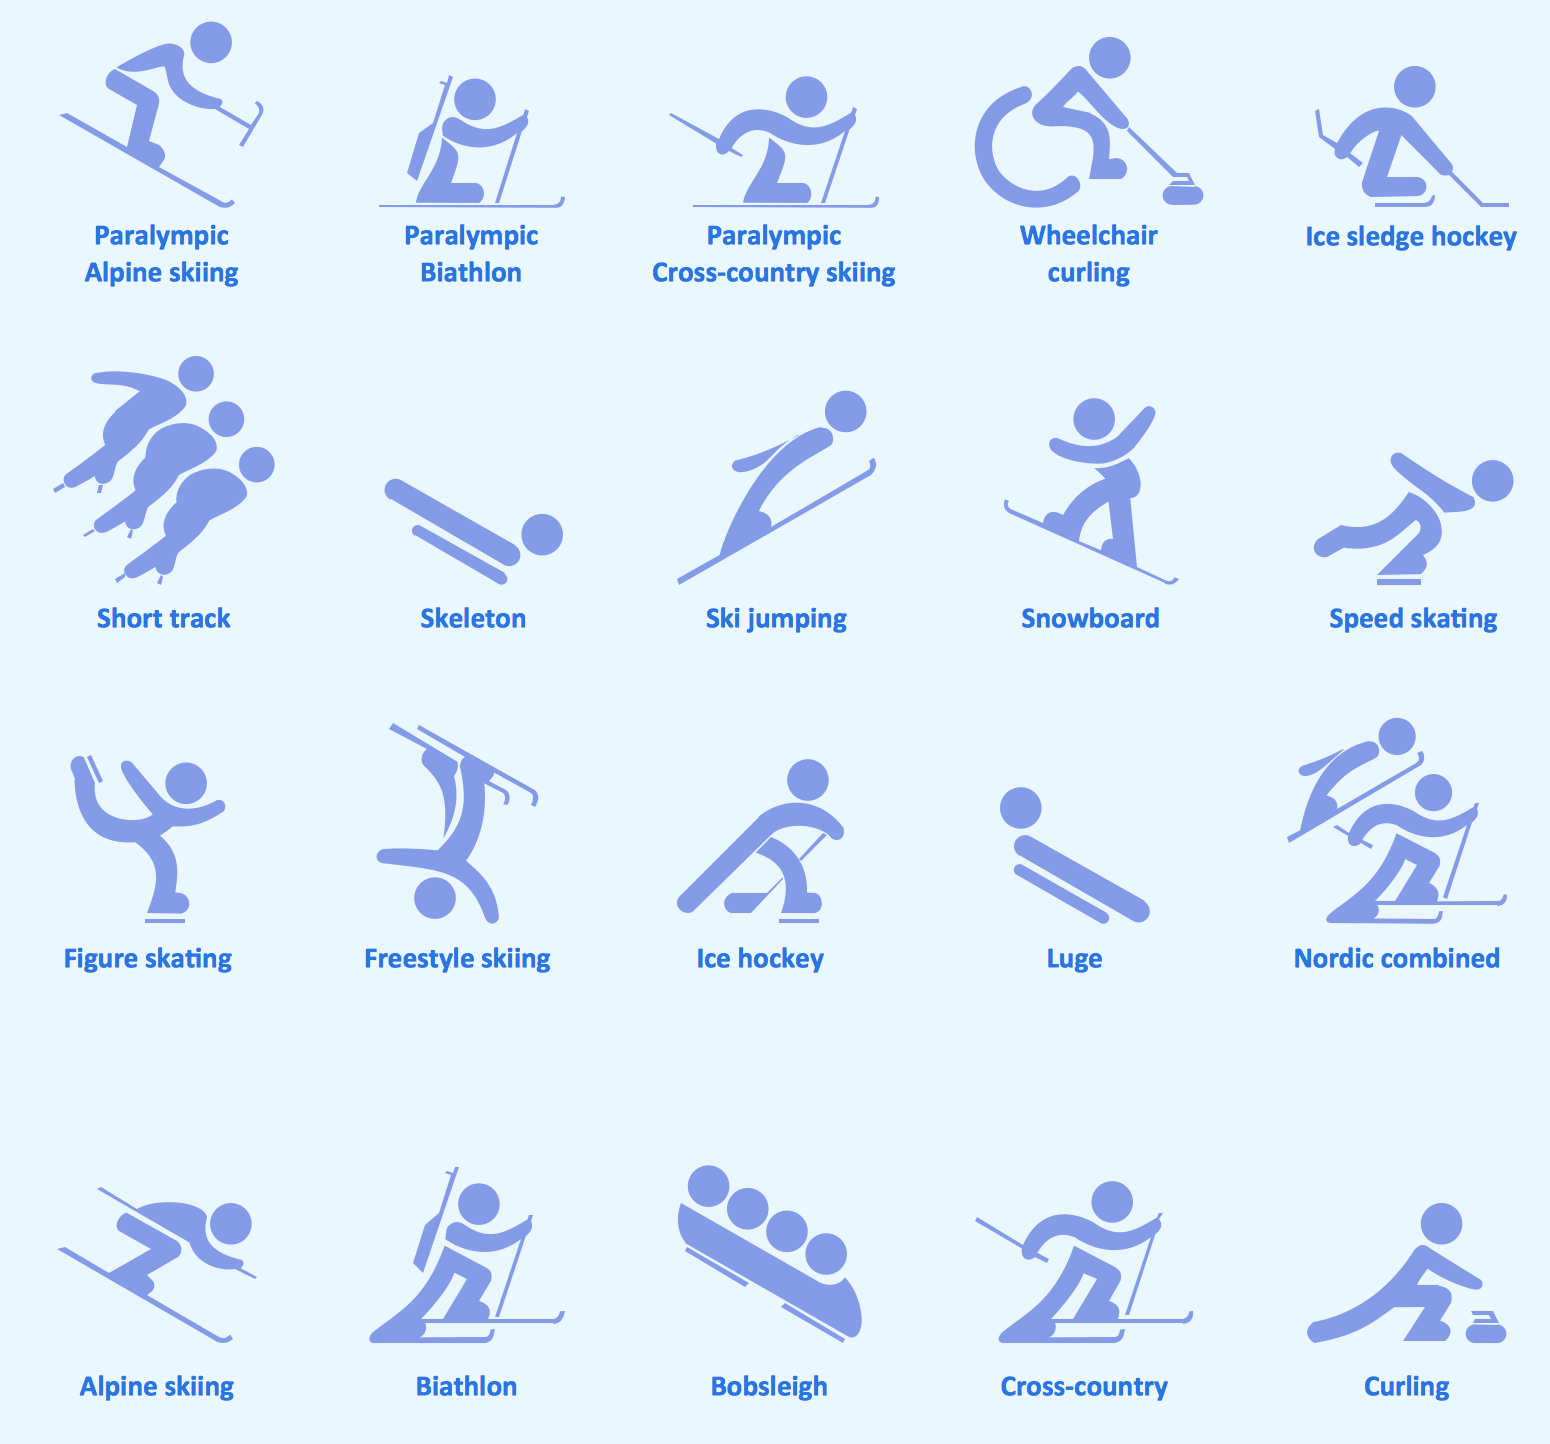
Sport pictograms. Olympic Games
The Winter Sports solution from Sport Area of ConceptDraw Solution Park contains winter sports pictograms you may use illustrating any kind of material about Olympic Games or any other sport competitions."Speed skating, or speedskating, is a competitive form of ice skating in which the competitors race each other in traveling a certain distance on skates. Types of speed skating are long track speed skating, short track speed skating, and marathon speed skating. In the Olympic Games, long-track speed skating is usually referred to as just "speed skating", while short-track speed skating is known as "short track". The ISU, the governing body of both ice sports, refers to long track as "speed skating" and short track as "short track skating". ...
The sport originates from pack-style events held in North America and was officially sanctioned in the 1970s, becoming an Olympic sport in 1992. Although this form of speed skating is newer, it is growing faster than long-track speed skating, largely because short track can be done on an ice hockey rink rather than a long-track oval." [Speed skating. Wikipedia]
The vector icon example "Speed skating" represents one of 20 symbols from the Winter sports pictograms library for the ConceptDraw PRO diagramming and vector drawing software.
The design elements library Winter sports pictograms is included in the Winter Sports solution from the Sport area of ConceptDraw Solution Park.
Flowchart
The Flowcharts are widespread in various fields and include the multitude of types. They are dedicated to representation the algorithms, processes, workflows of any complexity in a clear and intuitive format. The Flowcharts are commonly used in software development as a visual tool for illustration algorithms and logic of computer programs, in business for illustration business scenarios, in education, and so on. For drawing the Flowchart are used the special object blocks, among them rectangle or box used to represent an activity or step, rounded box or oval to depict Start / End, diamond to represent the decision point (involves the branching yes/no), circle used to represent the point of connection, parallelogram to represent the Input / Output, and some others. With ConceptDraw DIAGRAM including Flowcharts solution it is easy to create professional-looking Flowchart diagrams of any complexity and any degree of detailing. Succeed in drawing the Flowcharts using quick-start templates, predesigned samples and extensive libraries of ready-made flowchart symbols, blocks and icons.
 Area Charts
Area Charts are used to display the cumulative totals over time using numbers or percentages; or to show trends over time among related attributes. The Area Chart is effective when comparing two or more quantities. Each series of data is typically represented with a different color, the use of color transparency in an object’s transparency shows overlapped areas and smaller areas hidden behind larger areas.
- Olympic Games Types
- Types Of Olympic Games
- Sport pictograms. Olympic Games | Flow Chart for Olympic Sports ...
- Types Paralympic Games
- Winter Sports. Using Olympic Games Clipart to Illustrate Tournament ...
- Sport pictograms. Olympic Games | Influence Diagram Software ...
- Winter Sports. Olympic Games Illustrations. Medal Summary | Winter ...
- Winter Sports. Olympic Games Infographics. Medal Table | Winter ...
- Sport pictograms. Olympic Games | Winter Sports. Using Winter ...
- Design elements - Winter sports pictograms | Winter Olympics ...
- Winter Sports | Sport pictograms. Olympic Games | Speed skating ...
- Winter Sports. Olympic Games Illustrations. Medal Summary | Winter ...
- Winter Sports | Winter Sports. Olympic Games Illustrations. Medal ...
- Examples Of Business Game
- Basketball Illustrations | Flow Chart for Olympic Sports | Basketball ...
- Winter Sports. Olympic Games Infographics. Medal Table | Winter ...
- Winter Sports. Olympic Games Infographics. Medal Table | Winter ...
- Sport pictograms. Olympic Games
- Flow Chart for Olympic Sports | Winter Sports. Olympic Games ...
- Luge - Winter sports pictograms | Sport pictograms. Olympic Games ...


