HelpDesk
How to Create a Typography Infographic Using ConceptDraw PRO

Typography Font

HelpDesk
How to Create Infographics that Help People Eat Healthy

Education Infographics

Content Marketing Infographics

Educational Technology Tools

Educational Materials

 Fire and Emergency Plans
This solution extends ConceptDraw software with samples, templates and design elements for drawing the Fire and Emergency Plans.
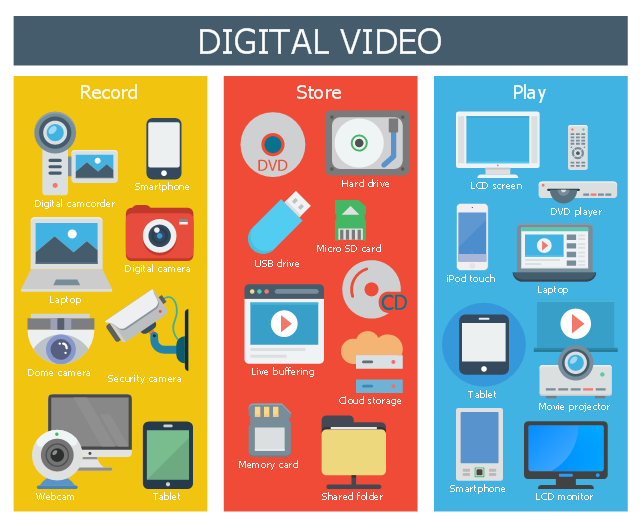
This infographic sample shows digital video devices for video record, store and play.
"Digital video is a representation of moving visual images in the form of encoded digital data. ...
QuickTime, Apple Computer's architecture for time-based and streaming data formats appeared in June, 1991. Initial consumer-level content creation tools were crude, requiring an analog video source to be digitized to a computer-readable format. While low-quality at first, consumer digital video increased rapidly in quality, first with the introduction of playback standards such as MPEG-1 and MPEG-2 (adopted for use in television transmission and DVD media), and then the introduction of the DV tape format allowing recordings in the format to be transferred direct to digital video files (containing the same video data recorded on the transferred DV tape) on an editing computer and simplifying the editing process, allowing non-linear editing systems (NLE) to be deployed cheaply and widely on desktop computers with no external playback/ recording equipment needed, save for the computer simply requiring a FireWire port to interface to the DV-format camera or VCR. The widespread adoption of digital video has also drastically reduced the bandwidth needed for a high-definition video signal (with HDV and AVCHD, as well as several commercial variants such as DVCPRO-HD, all using less bandwidth than a standard definition analog signal) and tapeless camcorders based on flash memory and often a variant of MPEG-4." [Digital video. Wikipedia]
The infographic example "Digital video" was created using the ConceptDraw PRO diagramming and vector drawing software extended with the Audio, Video, Media solution from the Illustrations area of ConceptDraw Solution Park.
Infographic
 Event-driven Process Chain Diagrams
Event-driven Process Chain (EPC) Diagram is a type of flowchart widely used for modeling in business engineering and reengineering, business process improvement, and analysis. EPC method was developed within the Architecture of Integrated Information Systems (ARIS) framework.
 Crow’s Foot Notation
Crow’s Foot Notation solution extends ConceptDraw PRO software with powerful drawing tools, samples and library of predesigned vector Crow's Foot notation icons to help you easy describe the databases using the Entity-Relationship models and design professional-looking ER diagrams based on the popular Crow's Foot notation.
HelpDesk
How to Draw Maps of Australia Using ConceptDraw PRO

 Divided Bar Diagrams
The Divided Bar Diagrams Solution extends the capabilities of ConceptDraw PRO v10 with templates, samples, and a library of vector stencils for drawing high impact and professional Divided Bar Diagrams and Graphs, Bar Diagram Math, and Stacked Graph.
- Typography And Editing Info Graphics Pdf
- Text Box Typography
- Basic Diagramming | Winter Sports. Olympic Games Infographics ...
- How to Create a Typography Infographic Using ConceptDraw PRO ...
- Design elements - Bulleted and numbered lists | Design elements ...
- Chore charts with ConceptDraw PRO | Typography Infographic ...
- How to Change the Font for an Entire Level of a Mind Map | How to ...
- How to Add Text to a Connector in ConceptDraw PRO ...
- Flowchart design. Flowchart symbols, shapes, stencils and icons ...
- Map Infographic Creator | How to draw Metro Map style infographics ...
- Flow chart Example. Warehouse Flowchart | Infographic Generator ...
- How to Use ConceptDraw Infographic in Presentations, Documents ...
- How to Change the Font for an Entire Level of a Mind Map | How to ...
- Design elements - Management list blocks | Design elements ...
- Hierarchy of laws | Design elements - Tabbed text blocks | Ribbon ...
- Design elements - Education callouts | Design elements - Callouts ...
- How To Create Restaurant Floor Plan in Minutes | Process ...
- Free Graphic Arts Program
- Graphic Arts
- Circle Arrow For Infographic Ppt