Quality Engineering Diagrams
Create Quality Engineering Diagrams (value stream maps) - for value stream analysis and value stream management, material and information flow mapping, using our quick start templates included with ConceptDraw.Data Flow Diagram Model
Data Flow Diagram (DFD) is a technique of graphical structural analysis, describing the sources external to the system, recipients of data, also logical functions, data flows and data stores that are accessed. The DFD's goal is to show how each process converts its inputs into the outputs and to identify relationships between these processes, at this make the system's description clear and understandable at every level of detail. Historically happened that for describing Data Flow Diagrams are used two notations - Yourdon and Gane-Sarson that differ each from other by graphical representation of symbols. The DFD model, like most other structural models is a hierarchical model. Each process can be subjected to decomposition on the structural components, the relationships between which in the same notation can be shown on a separate diagram. Typically, several DFD models are built when modeling the system. ConceptDraw PRO software enhanced with Data Flow Diagrams solution ideally suits for creation DFD models and professional drawing Data Flow Diagrams.Graphical Symbols to use in EPC diagrams
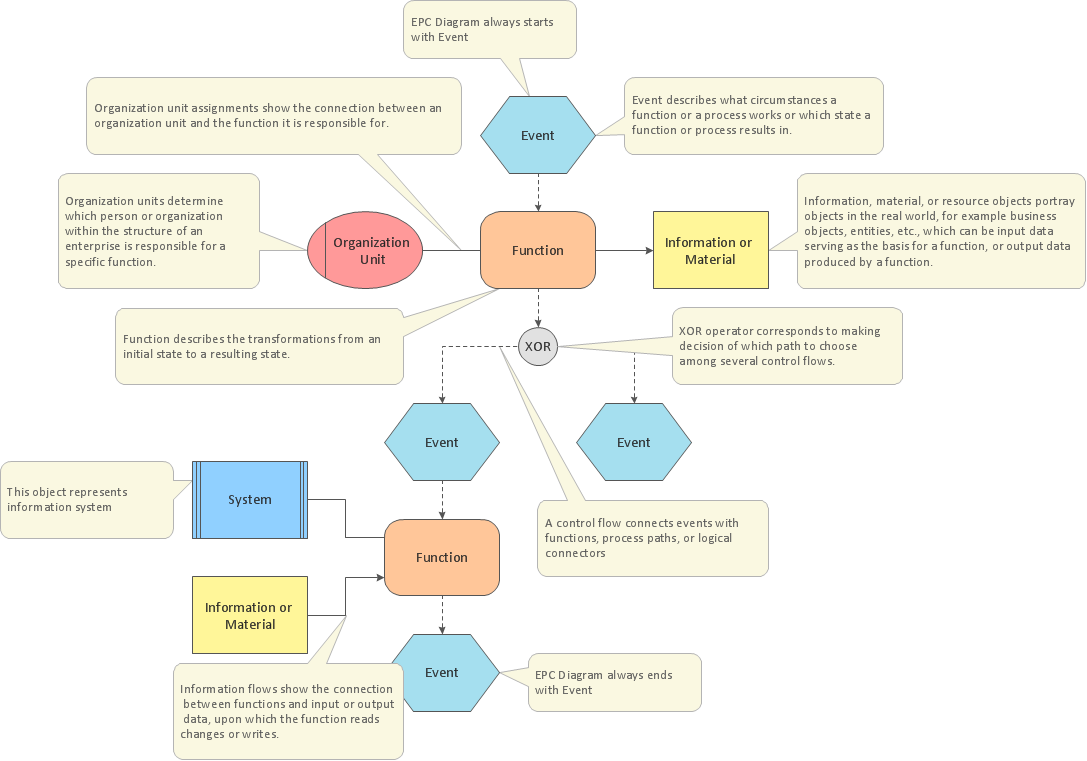
Event-Driven Process Chain Diagrams for improvement throughout an organisation. ConceptDraw PRO - software that reduces the time needed to create a business process model.
 Value Stream Mapping
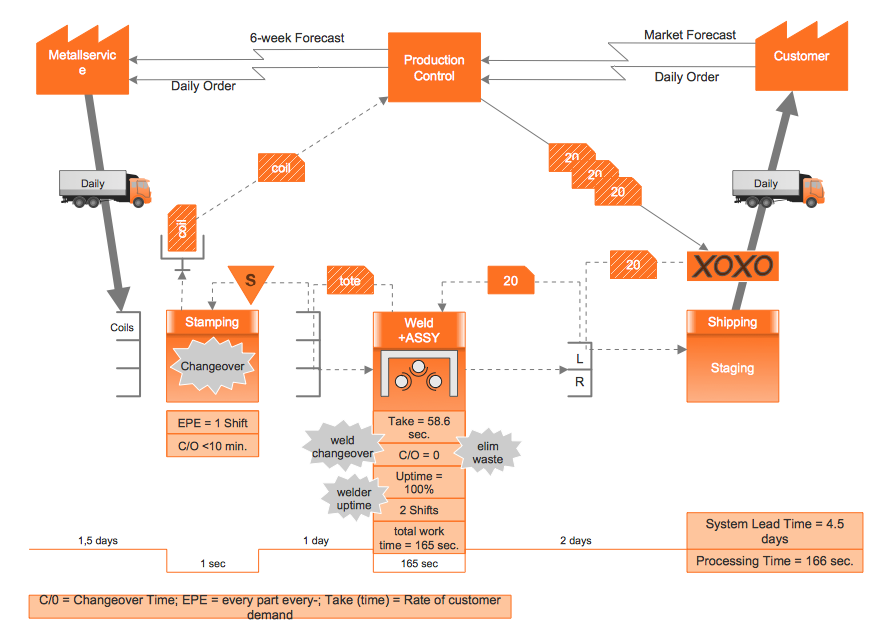
Value stream mapping solution extends ConceptDraw PRO software with templates, samples and vector stencils for drawing the Value Stream Maps (VSM) in lean manufacturing practice.
Business Process Modeling with EPC
Event-Driven Process Chain Diagrams for improvement throughout an organisation. ConceptDraw PRO - software that reduces the time needed to create a business process model.
 Quality Mind Map
This solution extends ConceptDraw MINDMAP software with Quality Management Mind Maps (Presentations, Meeting Agendas, Problem to be solved).
Flow chart Example. Warehouse Flowchart
Warehouse Flowcharts are various diagrams that describe the warehousing and inventory management processes on the warehouses. Typical purposes of Warehouse Flowcharts are evaluating warehouse performance, measuring efficiency of customer service and organizational performance. This type of Workflow diagrams can be used for identifying any disconnection between business activities and business objectives. They are effectively used by warehouse-related people and organizations, manufacturers, wholesalers, exporters, importers, transporters, and others. Standard Warehousing process flow diagram and standard Workflow diagram are used for process identification for further evaluating effectiveness and profitability of overall business process. Use the ConceptDraw PRO vector graphic software extended with Flowcharts solution to design your own professional-looking Workflow diagrams and Flowcharts of any types, including the Warehouse flowchart, Process flow diagrams which depict in details all steps of Warehouse packages flow. Microsoft Visio, designed for Windows users, can’t be opened directly on Mac. But fortunately, there are several Visio alternatives for Mac which will help Mac users to work Visio files. With ConceptDraw PRO, you may open, edit and save files in Visio format.
HelpDesk
How to Create a VSM Diagram Using ConceptDraw Value Stream Mapping Solution
Value Stream Mapping is a Lean Manufacturing tool that uses a flow diagram to document in great detail every step of a manufacturing process. This graphical representation of a process is a powerful tool that helps in the diagnosis of process efficiency and allows companies to develop improved processes. Many lean practitioners use Value Stream Mapping as a fundamental tool to identify waste, cut process cycle times, and implement process improvement. Many organizations use value stream mapping as a key portion of their lean efforts. Value Stream Maps are used to analyze and design the flow of materials and information required to bring a product or service to a consumer. You can create a Value Stream Mapping flowchart using ConceptDraw PRO tools.Business Processes
The most worked out and commonly used methodology of business processes description is IDEF methodology. Besides business processes it allows to describe functional blocks, for example production and marketing. ConceptDraw lets creation of business processes description using IDEF0 and IDEF2 methods.Introductory Guide to Rapid UML Solution
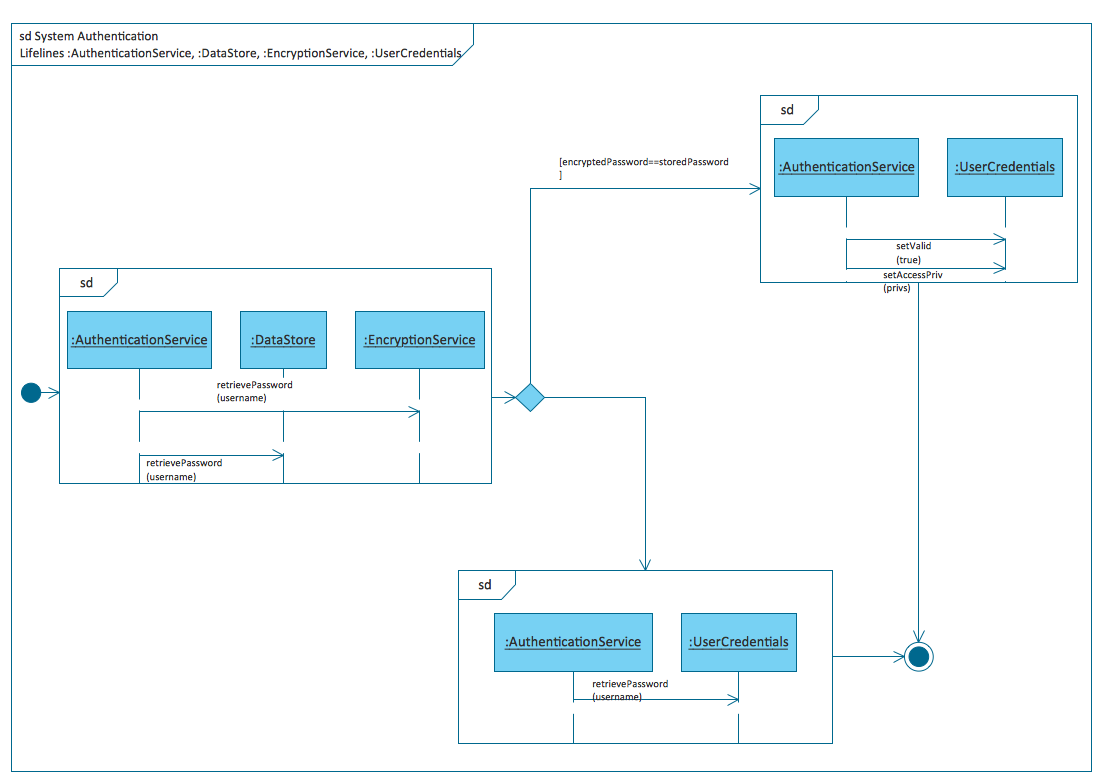
The ability to develop UML diagrams as quickly as the ideas come. The solution uses ConceptDraw RapidDraw techniques. The result is a vector graphic document.Business Diagram Software
When managing the projects, people, or networks, there are daily designed and used different types of Business diagrams, so the powerful drawing software will be very useful for this. ConceptDraw PRO with large quantity of business solutions will meet your needs and will help you convey your ideas successful and rapidly, no matter are you professional or beginner. It is the best choice for business specialists and technical professionals who need quickly and easily explore, visualize, and communicate information. ConceptDraw PRO business diagram software is the most powerful business software and relational charting software. Create advanced, completely customizable Business Process Diagrams, Business Flow Charts, Work Flow Diagrams, Organizational Charts, Audit diagrams, Marketing diagrams, Value Stream Maps, TQM diagrams, ERD diagrams, EPC diagrams, Cause and Effect diagrams, Infographics, Dashboards, and other Relational business diagrams from your data using the powerful drawing tools of ConceptDraw Solution Park.
Business Process Modeling with ConceptDraw
Business Process Modeling Notation -BPMN- is a set of standard symbols that allow you to create a graphical view of a business process. The symbols were developed to help users develop standard, unified structure of processes, and any messages shared between these processes. This is essense of business process improvement tools.MS Visio Look a Like Diagrams
No need for any special drawing skills to create professional looking diagrams outside of your knowledge base. ConceptDraw PRO takes care of the technical details, allowing you to focus on your job, not the drawing. ConceptDraw PRO delivers full-functioned alternative to MS Visio. ConceptDraw PRO supports import of Visio files. ConceptDraw PRO supports flowcharting, swimlane, orgchart, project chart, mind map, decision tree, cause and effect, charts and graphs, and many other diagram types.- Process Flowchart | ATM UML Diagrams | Lean Manufacturing ...
- Process Flowchart | Flowchart Software | Lean Manufacturing ...
- Manufacturing Block Diagrams
- Value Stream Mapping | How to Create a VSM Diagram Using ...
- Learn how to create a current state value stream map | Lean ...
- Best Value Stream Mapping mac Software | Circuits and Logic ...
- Cross-Functional Flowchart (Swim Lanes) | Diagramming Software ...
- TQM Diagram Tool | Probability Quality Control Tools | Quality ...
- UML Deployment Diagram . Design Elements | ERD Symbols and ...
- Active Directory Diagrams | UML Tool & UML Diagram Examples ...
- Bank Sequence Diagram | Cisco Network Diagrams | ATM UML ...
- Process Flowchart | Flowchart Definition | Graphical Symbols to use ...
- Process Flowchart | UML Class Diagram Example for Transport ...
- Uml Diagram For Computer Shop
- UML Tool & UML Diagram Examples | Artwork | Bank System | Use ...
- Fault Tree Analysis Diagrams | Manufacturing and Maintenance ...
- Process Flowchart | UML Diagram | Engineering | Control Flow ...
- ATM UML Diagrams | ConceptDraw Solution Park | Fishbone ...
- Process Flowchart | Cross-Functional Flowchart | UML Diagram ...
- Basic Flowchart Symbols and Meaning | Process Flowchart | Cross ...


