UML Class Diagram Constructor
UML Class Diagrams is a type of static structure diagram that is used both for general conceptual modeling of the systematics of the application, and for detailed modeling translating the models into programming code. It describes the structure of a system by showing the: classes of a system, attributes, operations, and the relationships between them. The Rapid UML Solution for ConceptDraw DIAGRAM includes the UML Class Diagram library that helps you to design the UML Class Diagram quick and easy. You can simply and quickly drop the ready-to-use objects from the library into your document to create the UML Class Diagram.Swim Lane Diagrams
Swim Lane Diagrams are the kind of process flow diagrams and effective tool for documenting the business processes required for any business company for its productive work, for easy defining the weak points, reasons of defects, or delays during the process. Swim Lane Diagram is based on the IDEF3 standard and was developed primarily for using in projecting. Its name derives from the use of horizontal or vertical lanes. The blocks that denote the parts of the processes are arranged within definite lanes according to the belonging to responsible worker. So the process of any complexity is visually divided into the parts and represented with indication the responsibility for execution of each part. This significantly facilitates the comprehension of its work. Use the ConceptDraw DIAGRAM software and predesigned vector objects from the Swim Lanes library of Business Process Mapping Solution included to ConceptDraw Solution Park to easy develop Swim Lanes Flowcharts and Diagrams, for modeling and documenting the business processes in a simple and visual graphic form.UML Notation
Unified Modeling Language (UML) is an open standard, the language of graphic description used for modeling objects in a field of software development and software engineering. It was created for definition, specification, visualization, designing and documenting software systems, as a unification of three object-oriented technologies Booch, OMT and OOSE, and uses the defined graphic notation for creating the visual models of object-oriented software systems. Description of UML consists of two parts, interactive and supplementing each other: UML semantics, which represents a certain metamodel, defines the abstract syntax and semantics of terms of object modeling with UML, and UML notation that is a graphic notation for visual representation of UML semantics. The powerful tools of the Rapid UML solution included to ConceptDraw Solution Park make the ConceptDraw DIAGRAM diagramming and vector drawing software the best for easy applying the UML notation when creating the visual models of object-oriented software systems and designing different kinds of UML diagrams.UML Class Diagram. Design Elements
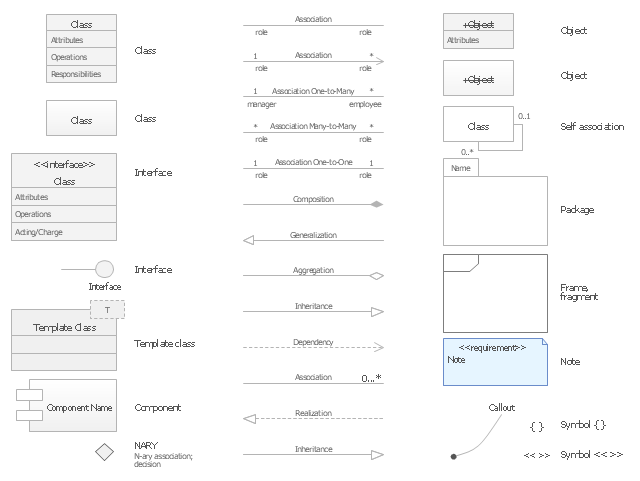
UML Class Diagrams describes the structure of a system by showing the system's classes, their attributes, and the relationships among the classes.The vector stencils library "UML class diagrams" contains 38 symbols for the ConceptDraw PRO diagramming and vector drawing software.
"... classes are represented with boxes which contain three parts:
(1) The top part contains the name of the class. It is printed in Bold, centered and the first letter capitalized.
(2) The middle part contains the attributes of the class. They are left aligned and the first letter is lower case.
(3) The bottom part gives the methods or operations the class can take or undertake. They are also left aligned and the first letter is lower case. ...
To indicate a classifier scope for a member, its name must be underlined. ...
An association can be named, and the ends of an association can be adorned with role names, ownership indicators, multiplicity, visibility, and other properties. ...
Aggregation ... is graphically represented as a hollow diamond shape on the containing class end of the tree with a single line that connects the contained class to the containing class.
... graphical representation of a composition relationship is a filled diamond shape on the containing class end of the tree of lines that connect contained class(es) to the containing class.
... graphical representation of a Generalization is a hollow triangle shape on the superclass end of the line (or tree of lines) that connects it to one or more subtypes.
... graphical representation of a Realization is a hollow triangle shape on the interface end of the dashed line (or tree of lines) that connects it to one or more implementers. A plain arrow head is used on the interface end of the dashed line that connects it to its users.
Multiplicity ... representation of an association is a line with an optional arrowhead indicating the role of the object(s) in the relationship, and an optional notation at each end indicating the multiplicity of instances of that entity (the number of objects that participate in the association).
Entity classes ... are drawn as circles with a short line attached to the bottom of the circle. Alternatively, they can be drawn as normal classes with the «entity» stereotype notation above the class name." [Class diagram. Wikipedia]
The example "Design elements - UML class diagrams" is included in the Rapid UML solution from the Software Development area of ConceptDraw Solution Park.
Event-Driven Process Chain Diagram Software
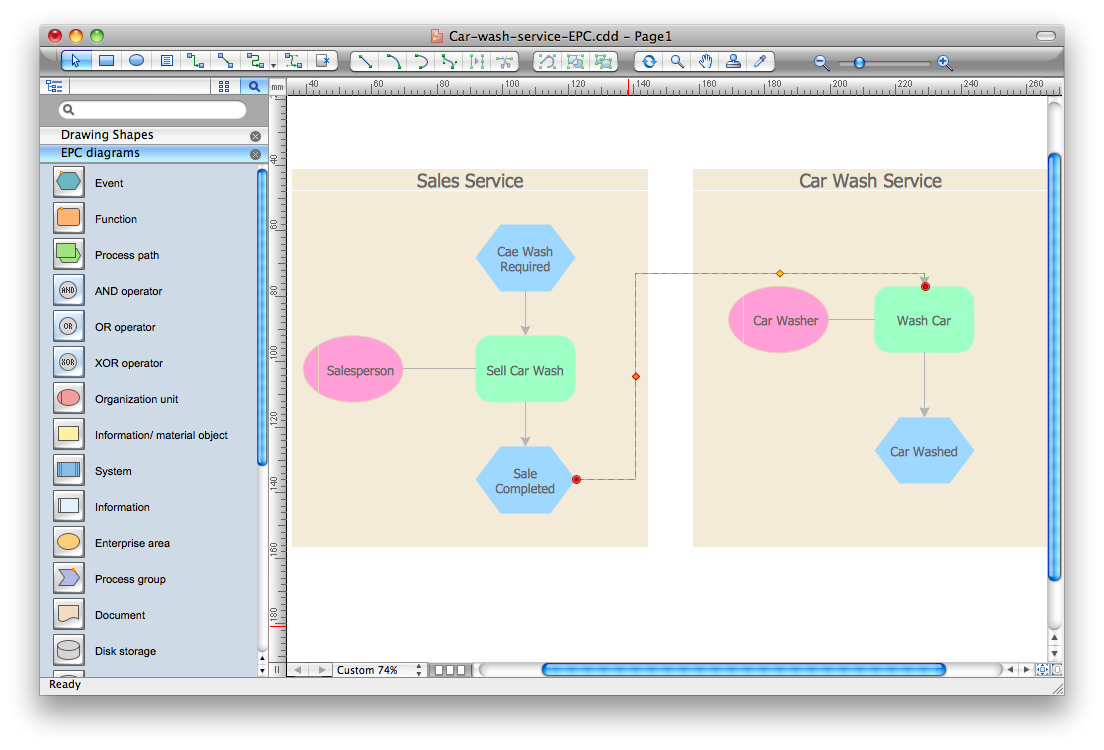
It’s very easy, quick and convenient to draw the Event-driven Process Chain (EPC) diagrams in ConceptDraw DIAGRAM diagramming and vector drawing software using the Event-driven Process Chain Diagrams Solution from the Business Processes area of ConceptDraw Solution Park.ConceptDraw DIAGRAM Network Diagram Tool
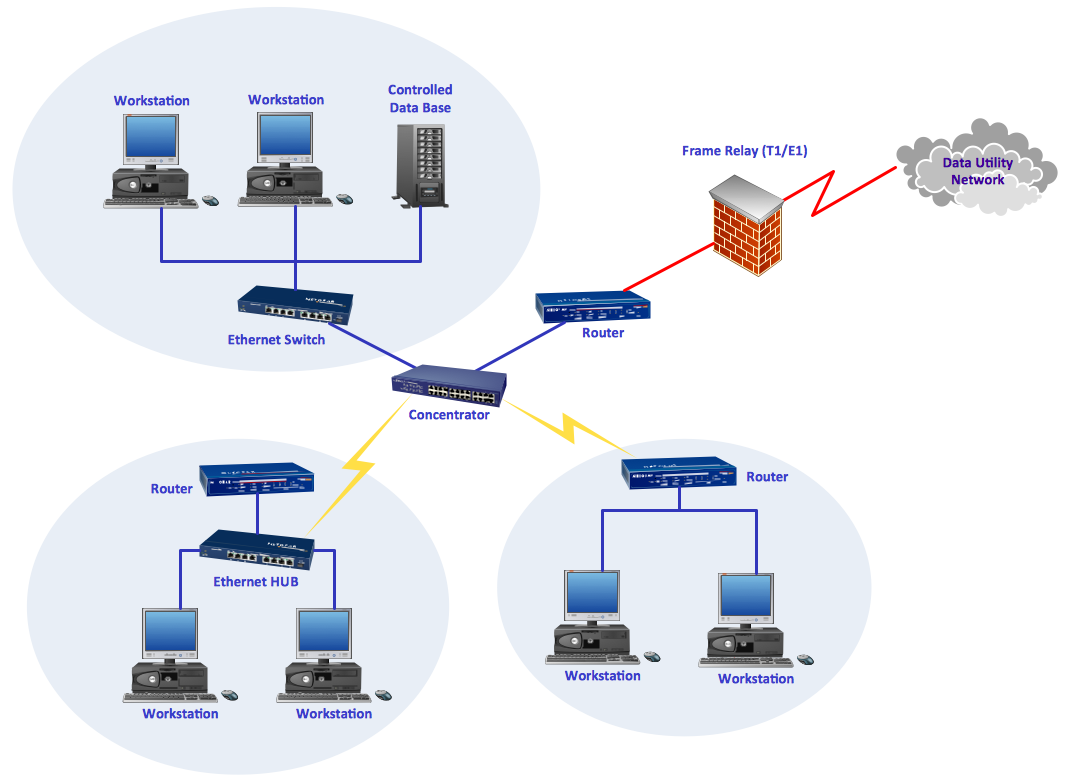
Computer network diagrams visually depict the nodes of computer networks and connections between them. Diversity of Network Diagrams includes Wireless network diagrams, Network wiring diagrams, LAN network diagrams, Network WAN diagrams, Network topology diagrams, Network cable diagrams, Logical network diagrams, Network security diagrams, Diagram home network, Network physical diagrams, Activity network diagrams, and many others. To construct any of them it is useful to apply a special software with effective network diagramming tools. ConceptDraw DIAGRAM is ideal and powerful network diagram tool. It helps you diagram a network or create Computer network diagrams of various types using specialized and task-specific libraries of network components such as computers, hubs, switches, servers, routers, smart connectors, printers, mainframes, face plates, etc. that simulate network architectures, network design topologies and devices (all these shapes are parts of network diagram tool ConceptDraw DIAGRAM ).
Taxi Service Data Flow Diagram DFD Example
This sample shows the Data Flow Diagram of the Taxi Service and interactions between the Clients, Operators and Divers, as well as Orders and Reports databases.How to Collaborate in Business via Skype
Collaboration software for small and medium business allows communicate with partners around the globe via Skype.
Probability Quality Control Tools
The Total Quality Management Diagram solution helps your organization visualize business and industrial processes. Create Total Quality Management diagrams for business process with ConceptDraw software.- UML Class Diagram Generalization Example UML Diagrams
- Design elements - UML class diagrams
- Uml Class Diagram Interface
- UML class diagram example
- Taxi Service Data Flow Diagram DFD Example | UML Use Case ...
- Design elements - UML class diagrams | DFD, Yourdon and Coad ...
- UML class diagram - Metadata information model | Design elements ...
- UML class diagram - Template | Design elements - UML class ...
- UML Activity Diagram. Design Elements | Business - Workflow ...


