Total Quality Management Value
The Total quality management (TQM) is an enterprise-wide method of continuous quality improvement of all organizational processes, including the enhancement of ability to deliver high-quality products and services to the customers. The TQM includes eight main elements, which have great value: customer-focused, process-centered, total employee involvement, integrated system, continual improvement, strategic and systematic approach, fact-based decision making, communications. ConceptDraw DIAGRAM diagramming and vector drawing software offers the Total Quality Management Diagram solution with effective drawing tools, predesigned vector elements, samples and templates that help easy design the Total Quality Management diagrams, TQM flowcharts and Mind Maps widely used in quality management projects to visualize the business processes and industrial processes for your organization, to demonstrate the quality control step-by-step in a visual manner, to compare visually the ideal and real stages of processes.Total Quality Management Definition
The Total Quality Management Diagram solution helps you and your organization visualize business and industrial processes. Create Total Quality Management diagrams for business process with ConceptDraw software.Geo Map — United States of America Map
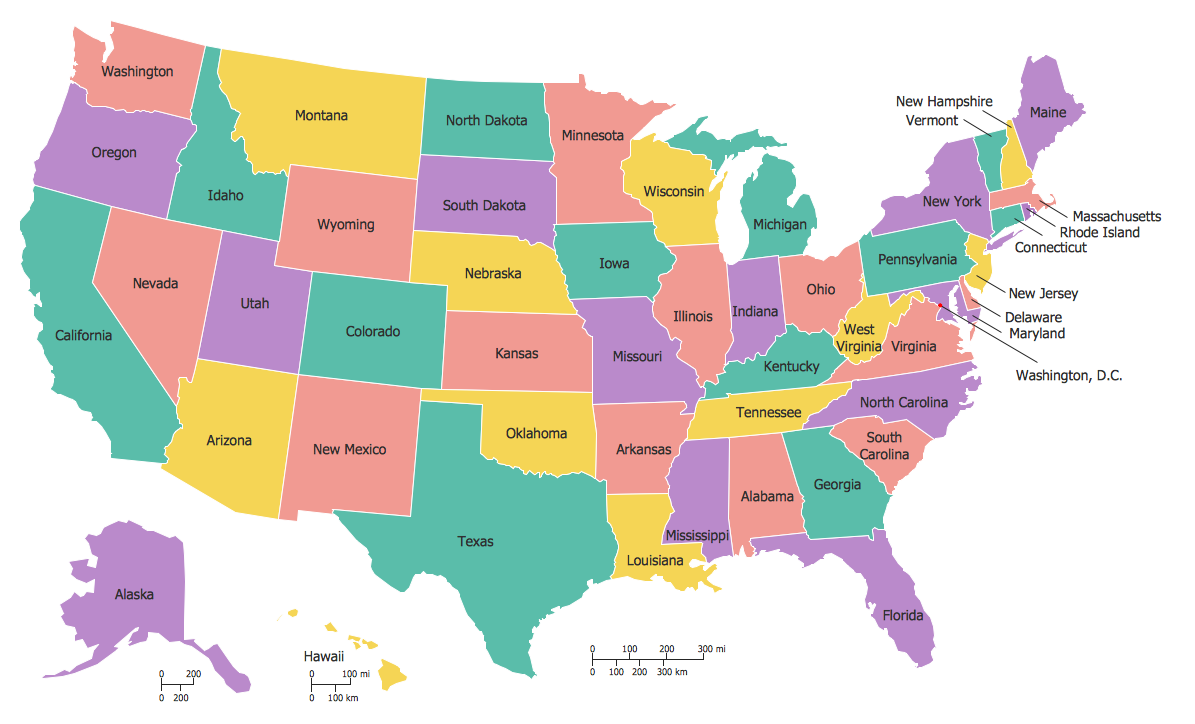
United States of America (USA) is a federal republic that includes 50 states and a federal district. It is the third largest country by population, fourth by the total area, and one of the most diverse in respect of nationalities and cultures. ConceptDraw DIAGRAM software extended with Continent Maps solution is ideal to draw professional looking Geological map of United States of America, USA map with states, the separate maps of different states of America, thematic maps, geospatial infographics, and varied vector illustrations for your business documents, presentations and websites. Use the pre-designed vector geo map shapes offered by numerous libraries, in particular by the United States of America library that contains 53 United States of America map contours. Each map is scaled, with the option to add the further levels of detail, thus the county borders, their names, capitals, and major cities can be instantly shown or hidden using the Action menu for each state map. ConceptDraw DIAGRAM software gives you a full control over the map size, shading, color fills and alignment.Learn how to create a current state value stream map
Value Stream Mapping solution extends ConceptDraw DIAGRAM software with templates, samples and vector shapes for drawing the current state value stream maps.Export from ConceptDraw DIAGRAM Document to a Graphic File
Now it’s easy to share your visual documents with other people in a form most convenient for them. ConceptDraw DIAGRAM can save your drawings and diagrams in a number of highly useful formats, including graphic files. You can save your drawing as a.PNG,.JPG, or other graphic format file.
 Target and Circular Diagrams
This solution extends ConceptDraw DIAGRAM software with samples, templates and library of design elements for drawing the Target and Circular Diagrams.
Types of Flowcharts
A Flowchart is a graphical representation of process, algorithm, workflow or step-by-step solution of the problem. It shows the steps as boxes of various kinds and connects them by arrows in a defined order depicting a flow. There are twelve main Flowchart types: Basic Flowchart, Business Process Modeling Diagram (BPMN), Cross Functional Flowchart, Data Flow Diagram (DFD), IDEF (Integrated DEFinition) Flowchart, Event-driven Process Chain (EPC) Diagram, Influence Diagram (ID), Swimlane Flowchart, Process Flow Diagram (PFD), Specification and Description Language (SDL) Diagram, Value Stream Mapping, Workflow Diagram. Using the Flowcharts solution from the Diagrams area of ConceptDraw Solution Park you can easy and quickly design a Flowchart of any of these types. This solution offers a lot of special predesigned vector symbols for each of these widely used notations. They will make the drawing process of Flowcharts much easier than ever. Pay also attention for the included collection of ready Flowchart examples, samples and quick-start templates. This is business process improvement tools. If you are looking for MS Visio for your Mac, then you are out of luck, because it hasn't been released yet. However, you can use Visio alternatives that can successfully replace its functions. ConceptDraw DIAGRAM is an alternative to MS Visio for Mac that provides powerful features and intuitive user interface for the same.
 Organizational Charts
Organizational Charts solution extends ConceptDraw DIAGRAM software with samples, templates and library of vector stencils for drawing the org charts.
- Diagram Of The United States
- The Diagram Of The United State
- Usa Diagram
- Geo Map - United States of America Map | Learn how to create a ...
- USA Maps | Geo Map - USA - California | Geo Map - United States of ...
- Diagram Of Usa States Map
- London election results | 2012 United States presidential election ...
- The Diagram Of Map Of United State
- Diagram Of A Map Showing The Unit States And The Central
- Federal States of Germany map - Template | UML state machine ...


