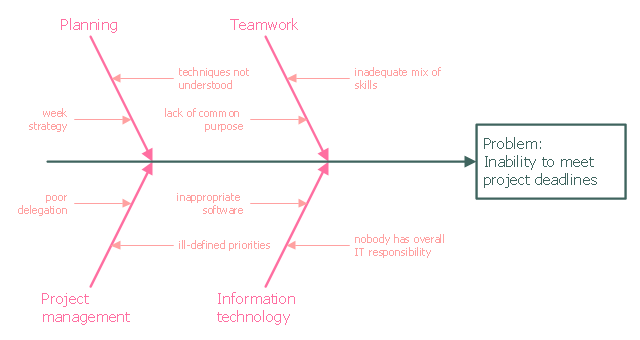
This example was created on the base of the figure from the website of the Iowa State University Center for Excellence in Learning and Teaching.
"Fishbone.
What: The fishbone technique uses a visual organizer to identify the possible causes of a problem.
Benefits: This technique discourages partial or premature solutions and demonstrates the relative importance of, and interactions between, different parts of a problem.
How: On a broad sheet of paper, draw a long arrow horizontally across the middle of the page pointing to the right. Label the arrowhead with the title of the issue to be explained. This is the "backbone" of the "fish." Draw "spurs" from this "backbone" at about 45 degrees, one for every likely cause of the problem that the group can think of; and label each. Sub-spurs can represent subsidiary causes. The group considers each spur/ sub-spur, taking the simplest first, partly for clarity but also because a simple explanation may make more complex ones unnecessary. Ideally, the fishbone is redrawn so that position along the backbone reflects the relative importance of the different parts of the problem, with the most important at the head." [celt.iastate.edu/ creativity/ techniques.html]
The fishbone diagram example "Inability to meet project deadlines" was created using the ConceptDraw PRO diagramming and vector drawing software extended with the Fishbone Diagrams solution from the Management area of ConceptDraw Solution Park.
HelpDesk
How to Draw an Organizational Chart Using ConceptDraw PRO
The organizational chart software is a valuable tool for modern business. It is important for any business to build a clear organizational structure that determines the responsibilities and relationships between different positions in the organization. The clear structured organization - means the clear structured business workflow, which is the core of success in the business. ConceptDraw PRO is an org chart software that allows you to draw an organizational structure of your company quickly and easily.- Fishbone Diagram Problem Solving | Using Fishbone Diagrams for ...
- Cause and Effect Analysis - Fishbone Diagrams for Problem Solving ...
- Cause and Effect Analysis | PROBLEM ANALYSIS. Identify and ...
- Service 8 Ps fishbone diagram - Template | SWOT analysis for a ...
- Using Fishbone Diagrams for Problem Solving | Fishbone Diagram ...
- How Do Fishbone Diagrams Solve Manufacturing Problems | Draw ...
- Fishbone Diagram Example Hospital Problem
- How to Construct a Fishbone Diagram | Fishbone Diagrams | Café ...
- Draw Fishbone Diagram on MAC Software | ConceptDraw PRO ...
- Fishbone diagram - Inability to meet project deadlines | Fishbone ...
- Service 8 Ps fishbone diagram - Template | SWOT analysis for a ...
- How Do Fishbone Diagrams Solve Manufacturing Problems | Draw ...
- Fishbone Diagram | Fishbone Diagram Problem Solving | Total ...
- Fishbone Diagrams | Fishbone Diagram | Create Fishbone ...
- Basic Flowchart Symbols and Meaning | How Do Fishbone ...
- Fishbone Diagrams | SWOT Analysis Software | Fishbone Diagram ...
- Using Fishbone Diagrams for Problem Solving | Cause and Effect ...
- How Do Fishbone Diagrams Solve Manufacturing Problems ...
- Fishbone Diagram Less Production Problem
- Using Fishbone Diagrams for Problem Solving | Venn Diagram ...

