Basic Flowchart Symbols and Meaning


 Sales Flowcharts
The Sales Flowcharts solution lets you create and display sales process maps, sales process workflows, sales steps, the sales process, and anything else involving sales process management.
Pyramid Diagram

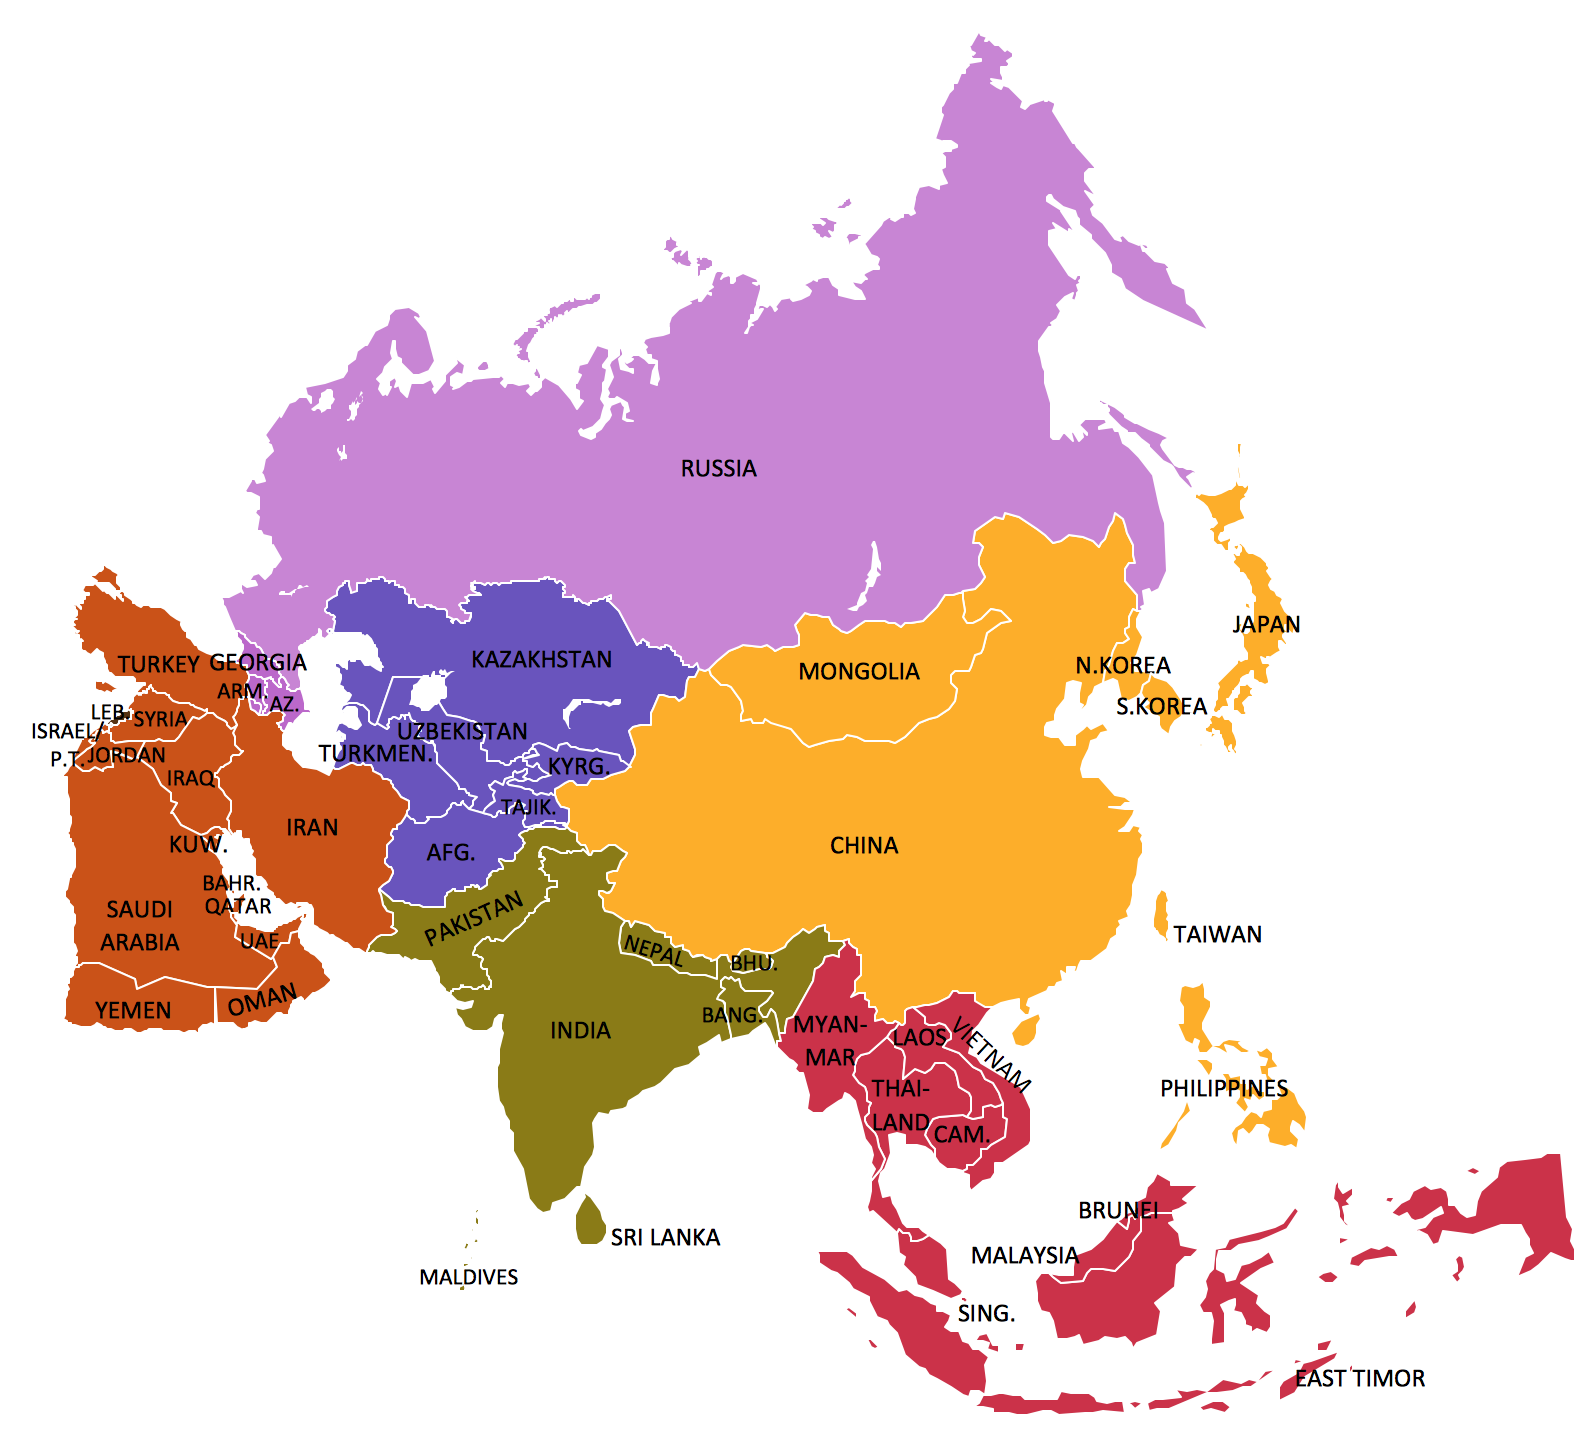
Geo Map — Asia
The vector stencils library "Sales KPIs and Metrics" contains 15 chart templates and graphic indicators of sales key performance indicators (KPIs) and metrics.
Use it for drawing sales dashboards in the ConceptDraw PRO diagramming and vector drawing software extended with the Sales Dashboard solution from the Marketing area of ConceptDraw Solution Park.
Use it for drawing sales dashboards in the ConceptDraw PRO diagramming and vector drawing software extended with the Sales Dashboard solution from the Marketing area of ConceptDraw Solution Park.
Actual vs Plan

Average Purchase Value

Clicks from Sales Follow-Up Emails

Cost per customer

Cost per order

Lead Response Time

Opportunity-to-Win Ratio

Product mix

Product Performance

Rate of Contact

Rate of Follow Up Contact

Sales Growth

Sales Target

Social Media Usage

Usage Rate of Marketing Collateral

 HR Flowcharts
Human resource management diagrams show recruitment models, the hiring process and human resource development of human resources.
The vector stencils library "Sales arrows" contains 57 arrow symbols.
Use these arrow icon set to draw your sales flowcharts, workflow diagrams and process charts with the ConceptDraw PRO diagramming and vector drawing software.
The arrow pictograms library "Sales arrows" is included in the Sales Flowcharts solution from the Marketing area of ConceptDraw Solution Park.
Angle arrow
Arc arrow
Arki arrow
Arrow fork
Arrow loop
Bent arrow
Chevron arrow
Circular arrow
Circular motion arrows
Clockwise arrow
Corner arrow
Counterclockwise arrow
Crossed arrows
Curved left arrow
Curved right arrow
Curving directional arrow
Cycle arrow
Diagonal arrow
Double arc arrow
Double headed arrow
Double headed semicircle arrow
Down arrow
Dual short arc arrow
Elbow arrow
Fat arrow
Go back arrow
Interaction arrows
L-shaped arrow
Left arrow
Lightning arrow
Long arc arrow
Looping arrows
Merging arrows
Moving down arrow
Moving up arrow
Recycling arrows
Refresh arrows
Ribbon arrow
Right arrow
Rotating arrows
S-shaped arrow
Sector arrow
Semicircle arrow
Short arc arrow
Single headed arrow
Small arrow
Split arrow
Straight arrow
Triangle arrow
Turn left arrow
Turn right arrow
Turn round arrow
Turned arrow
Up arrow
U-shaped arrow
Vertical moving arrow
Wavy arrow
The vector stencils library "Sales KPIs and Metrics" contains 15 chart templates and graphic indicators of sales key performance indicators (KPIs) and metrics.
Use it for drawing sales dashboards in the ConceptDraw PRO diagramming and vector drawing software extended with the Sales Dashboard solution from the Marketing area of ConceptDraw Solution Park.
Use it for drawing sales dashboards in the ConceptDraw PRO diagramming and vector drawing software extended with the Sales Dashboard solution from the Marketing area of ConceptDraw Solution Park.
Actual vs Plan
Average Purchase Value
Clicks from Sales Follow-Up Emails
Cost per customer
Cost per order
Lead Response Time
Opportunity-to-Win Ratio
Product mix
Product Performance
Rate of Contact
Rate of Follow Up Contact
Sales Growth
Sales Target
Social Media Usage
Usage Rate of Marketing Collateral
Sales Process Flowchart Symbols

The vector stencils library "Sales symbols" contains 55 sales process pictograms.
Use it to design your sales flowcharts, workflow diagrams and process charts by the ConceptDraw PRO diagramming and vector drawing software.
"A sales process is an approach to selling a product or service.
... a "sales process" is presented as consisting of eight steps. These are:
(1) Prospecting / initial contact,
(2) Preapproach - planning the sale,
(3) Identifying and cross questioning,
(4) Need assessment,
(5) Presentation,
(6) Meeting objections,
(7) Gaining commitment,
(8) Follow-up." [Sales process. Wikipedia]
The icons example "Design elements - Sales symbols" is included in the Sales Flowcharts solution from the Marketing area of ConceptDraw Solution Park.
Sales icon set
- Business feedback loop | Sales Flowcharts | Design elements ...
- Yellow Arrows Down Png
- Sales Marketing Vector Png
- Orange Refresh Icon Png
- Arrows - Vector clipart library | Sales arrows - Vector stencils library ...
- Cycle Arrow Clipart Png
- Sales arrows - Vector stencils library | Basic Flowchart Symbols and ...
- Curved Arrow Clipart Png Transparent
- Sales Funnel Icon Png
- Basic Flowchart Symbols and Meaning | Basketball | Wavy Arrows Png