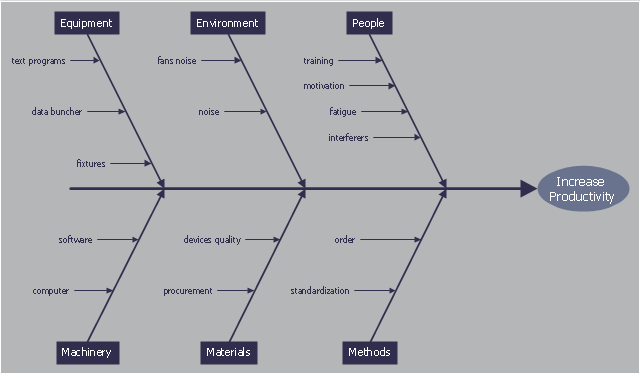
This cause and effect diagram sample was redesigned from the Wikimedia Commons file: Ursache Wirkung Diagramm Beispiel.png. [commons.wikimedia.org/ wiki/ File:Ursache_ Wirkung_ Diagramm_ Beispiel.png]
This file is licensed under the Creative Commons Attribution-Share Alike 3.0 Unported license. [creativecommons.org/ licenses/ by-sa/ 3.0/ deed.en]
"Productivity is the ratio of output to inputs in production; it is an average measure of the efficiency of production. Efficiency of production means production’s capability to create incomes which is measured by the formula real output value minus real input value.
Productivity is a crucial factor in production performance of firms and nations. Increasing national productivity can raise living standards because more real income improves people's ability to purchase goods and services, enjoy leisure, improve housing and education and contribute to social and environmental programs. Productivity growth also helps businesses to be more profitable." [Productivity. Wikipedia]
The fishbone diagram example "Increase in productivity" was created using the ConceptDraw PRO diagramming and vector drawing software extended with the Fishbone Diagrams solution from the Management area of ConceptDraw Solution Park.
- Fish Bone Diagramm Beispiel Output
- Total Quality Management Value | Cause and effect diagram ...
- Cause and effect diagram - Increase in productivity | Home area ...
- Cause and effect diagram - Increase in productivity | Fishbone ...
- Fishbone diagram - Bad coffee | Cause and effect diagram ...
- Cause and effect diagram - Increase in productivity | Total Quality ...
- Cause and effect diagram - Increase in productivity | HR symbols ...
- Fishbone Diagrams | Cause and effect diagram - Increase in ...
- Effects of taxes and benefits | Cause and effect diagram - Increase in ...
- Cause and effect diagram - Increase in productivity | Drawing ...
- Cause and effect diagram - Increase in productivity | Bar Diagrams ...
- Cause and effect diagram - Increase in productivity | The Best ...
- Cause and effect diagram - Increase in productivity | Process ...
- Cause and effect diagram - Increase in productivity | Porter five ...
- Cause and Effect Diagram
- Cause and effect diagram - Increase in productivity | Create ...
- Cause and effect diagram - Increase in productivity | Draw Fishbone ...
- Productivity Cause And Effect Diagram
- Flowchart on Bank. Flowchart Examples | UML Use Case Diagram ...
- Fishbone Diagram | Fishbone Diagram Procedure | Fishbone ...
