Flowchart Examples
It’s very simple, convenient and quick to design professional looking Flowcharts of any complexity using the ConceptDraw PRO diagramming and vector drawing software extended with Flowcharts Solution from the "Diagrams" Area of ConceptDraw Solution Park which provides a wide set of predesigned objects, templates, samples and Flowchart examples.
 ATM UML Diagrams
The ATM UML Diagrams solution lets you create ATM solutions and UML examples. Use ConceptDraw PRO as a UML diagram creator to visualize a banking system.
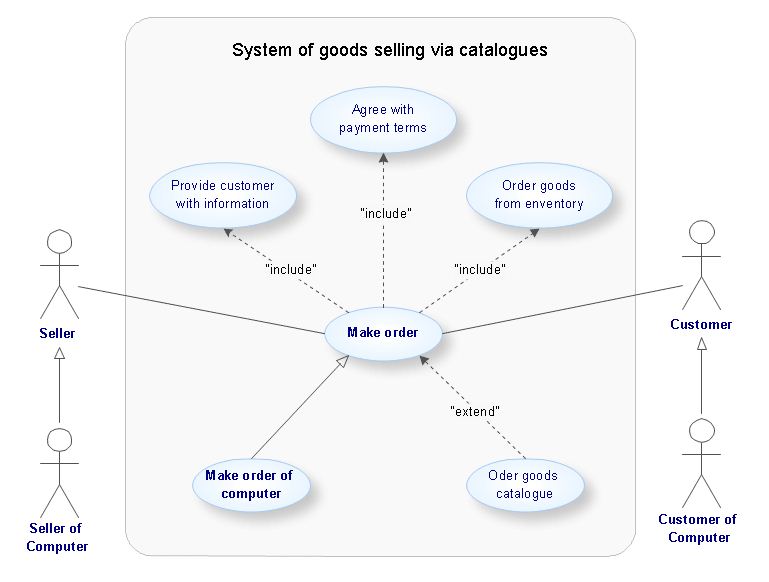
Jacobson Use Cases Diagram
The vector stencils library UML Use Case contains specific symbols of the UML notation such as actors, actions, associations and relationships for the ConceptDraw PRO diagramming and vector drawing software. This library is contained in the Rapid UML solution from Software Development area of ConceptDraw Solution Park.UML Diagram Visio
This sample shows the UML Class Diagram that was created in ConceptDraw PRO on the Mac and then was opened for editing in MS Visio. Using the 13 libraries of the Rapid UML Solution for ConceptDraw PRO you can create your own visual vector UML diagrams quick and easy.ConceptDraw PRO UML Diagrams with ConceptDraw PRO
ConceptDraw PRO is a great UML modeling and design tool that enables you to quickly and easily generate all types of UML diagrams. ConceptDraw PRO offers a large collection of industry-standard UML object libraries for all types of UML diagrams.
 SYSML
SYSML
The SysML solution helps to present diagrams using Systems Modeling Language; a perfect tool for system engineering.
Create Sophisticated Professional Diagrams - Simply
ConceptDraw PRO is a powerful software that helps you create professional and easy drawing diagrams for business, technology, science and education.Developing Entity Relationship Diagrams
When you need to visually represent the structure of relational database, Entity relationship diagram (ERD) is a type of diagram for that case. Most entity-relationship diagrams can be built with objects from Flowchart solution or ERD Solution which contains inbuilt templates. Follow these steps to create your own custom ERD diagram. Don't be frightened if it looks complex, ConceptDraw PRO makes it easy to create an ERD, and hundreds of other diagrams, in minutes.Entity Relationship Diagram Symbols
The semantic modeling method nowadays is successfully applied in database structure design. It is effective method of modeling the data structures, which is based on the meaning of these data. As a tool of semantic modeling, there are used different types of Entity-Relationship Diagrams. Entity Relationship Diagram (ERD) is applied to visually and clearly represent a structure of a business database. The main components of ERDs are: entity, relation and attributes. An entity is a class of similar objects in the model, each entity is depicted in the form of rectangle and has the name expressed by a noun. Relation is shown in the form of non-directional line that connects two entities. There are several notation styles used for ERDs: information engineering style, Chen style, Bachman style, Martin Style. The Entity Relationship Diagram symbols used for professional ERD drawing are predesigned by professionals and collected in the libraries of the Entity-Relationship Diagram (ERD) solution for ConceptDraw PRO software.
 Fishbone Diagrams
The Fishbone Diagrams solution extends ConceptDraw PRO v10 software with the ability to easily draw the Fishbone Diagrams (Ishikawa Diagrams) to clearly see the cause and effect analysis and also problem solving. The vector graphic diagrams produced using this solution can be used in whitepapers, presentations, datasheets, posters, and published technical material.
- ConceptDraw Solution Park | Sequence Diagram For Amusement Park
- Uml Diagram For Amusement Park
- Amusement Park Use Case Daigram
- Amusement Park Management Sequence Diagram
- Database Management System Theme Park Sample Project
- Theme Park Management Uml Diagrams
- Waterpark Managment Use Case Diagram
- ConceptDraw Solution Park | Fishbone Diagram | Flowchart ...
- Water Park Management System Er Diagram


