HelpDesk
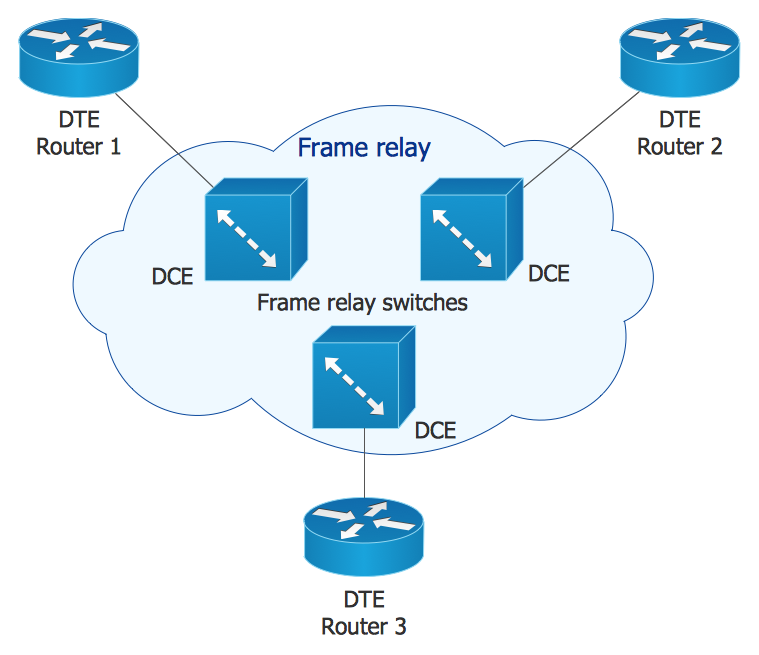
How to Create Cisco Network Diagram Using ConceptDraw Libraries
Cisco Network chart can be a great start for detailed network documentation, as well as serve as a visual instruction for new IT staff, or as a detailed illustration for a presentation. The easiest way to design Cisco Network diagram using standard Cisco product symbols is using ConceptDraw PRO powered by Cisco Network Diagrams solution. The Cisco Network Diagrams solution uses Cisco network symbols and icons to to visually document the Cisco network topology and design of Cisco network diagrams. Using ConceptDraw libraries you can access a wide array of Cisco network icons, so you can quickly prototype a new network or document an existing one.HelpDesk
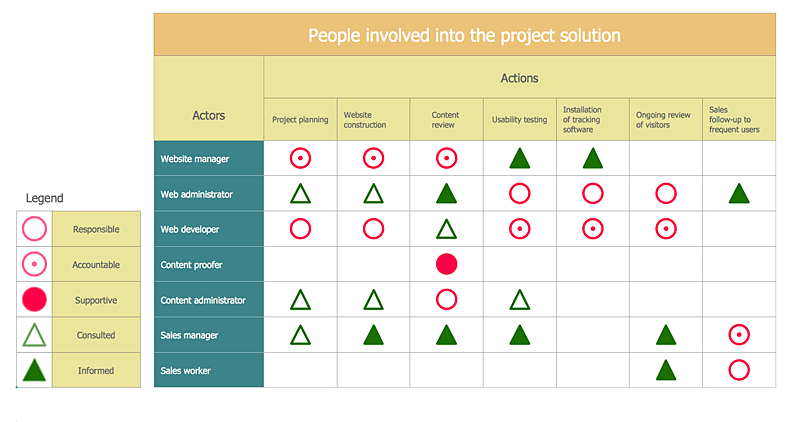
How To Create an Involvement Matrix
The Involvement Matrix can identify the distribution of responsibilities and identify roles in a group or team. This matrix can be used company wide. The Involvement Matrix identifies participants who are involved in corrective actions. The Involvement Matrix is constructed for all highly prioritized corrective actions. It uses symbols to assign who participates, performs, consults, should be informed, checks the work, and accepts the results. Using visual diagrams keeps ideas clear and is very effective when discussing the problem and a description of the solution. They are great at helping to quickly see what stage of the problem-solving effort is currently underway.It defines the participants and their roles. The matrix displays all of the parties involved, defines their level of involvement, and the nature of their participation. The ability to create an Involvement Matrix is supported by the ConceptDraw Seven Management and Planning Tools solution.HelpDesk
How to Draw the Different Types of Pie Charts
Using the Pie Chart, you can visually estimate the relative contribution that different data categories contribute to a whole value. The pie chart displays the statistics in a visual format. The main use of pie charts to show comparisons. The larger piece of the pie, the more the value of this value compared to the rest. Various applications of pie charts can be found in business and education. For business, pie charts can be used to compare the success or failure of the goods or services. They may also be used to display the business market share.HelpDesk
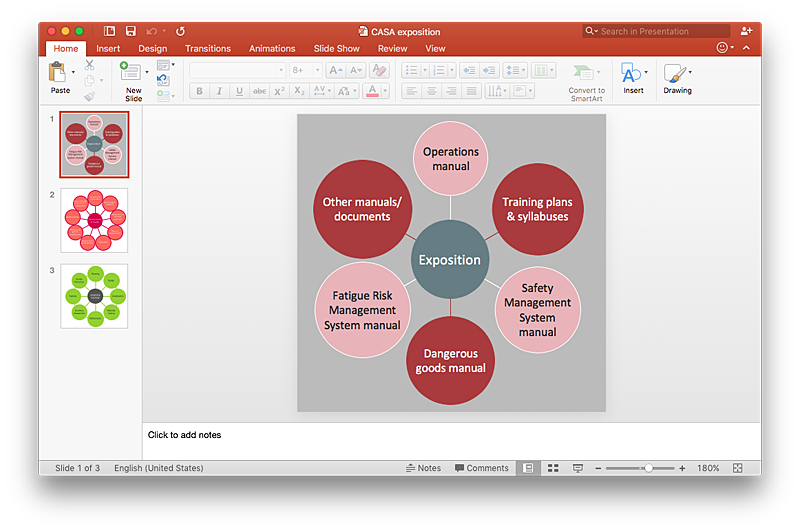
How to Add a Circle-spoke Diagram to a PowerPoint Presentation Using ConceptDraw PRO
ConceptDraw PRO can be used as a tool for creating circle spoke diagrams along with other marketing diagrams. ConceptDraw PRO allows you to make a MS PowerPoint Presentation from your marketing diagrams in a few simple steps.- Flowchart design. Flowchart symbols , shapes, stencils and icons ...
- Basic Flowchart Symbols and Meaning | Flowchart design ...
- Basic Flowchart Symbols and Meaning | Process Flowchart | Types ...
- Flowchart Symbols And It Uses
- Data Flow Diagram Symbols . DFD Library | Basic Flowchart ...
- Basic Flowchart Symbols and Meaning | Process Flowchart ...
- Basic Flowchart Symbols and Meaning | Flow Chart Symbols ...
- Flowchart Uses Standard Symbols Called
- Flowchart Symbols And Their Uses
- Basic Flowchart Symbols | Types of Flowcharts | UML Notation ...
- Basic Flowchart Symbols and Meaning | Types of Flowcharts | Types ...
- Basic Flowchart Symbols and Meaning | Flowchart design ...
- Basic Flowchart Symbols and Meaning | Cross-Functional Flowchart ...
- Flowchart Symbols Uses
- Flowchart Symbols Amd Their Uses
- Twenty Computer Flowchart Symbols And There Uses
- Flowchart Diagram Symbols And Uses
- Basic Flowchart Symbols and Meaning | Types of Flowcharts | Types ...
- Basic Flowchart Symbols and Meaning | Flow Chart Symbols ...


