SWOT Matrix Template
SWOT analysis is a structured planning method, which lets define the objective of the business, internal and external factors favorable or unfavorable for achieving this objective, represent Strengths, Weaknesses, Opportunities, and Threats on the SWOT Matrix. SWOT analysis can be conducted for an industry, company, product, place, or person. It lets to choose the best path for development of an organization, helps to avoid dangers, gives opportunity to establish relationship between the potential of an organization and the problems, lets to assess the values of profitability and compare them with performance of competitors, gives the possibility to expand and enhance the competitive advantages. SWOT and TOWS Matrix Diagrams solution included to ConceptDraw Solution Park contains wide variety of SWOT and TOWS matrix diagrams examples and samples, and also specially developed templates. Each SWOT template have great value in easy and quick drawing of SWOT matrices and diagrams in ConceptDraw DIAGRAM diagramming and vector drawing software for Mac OSX and Windows.HelpDesk
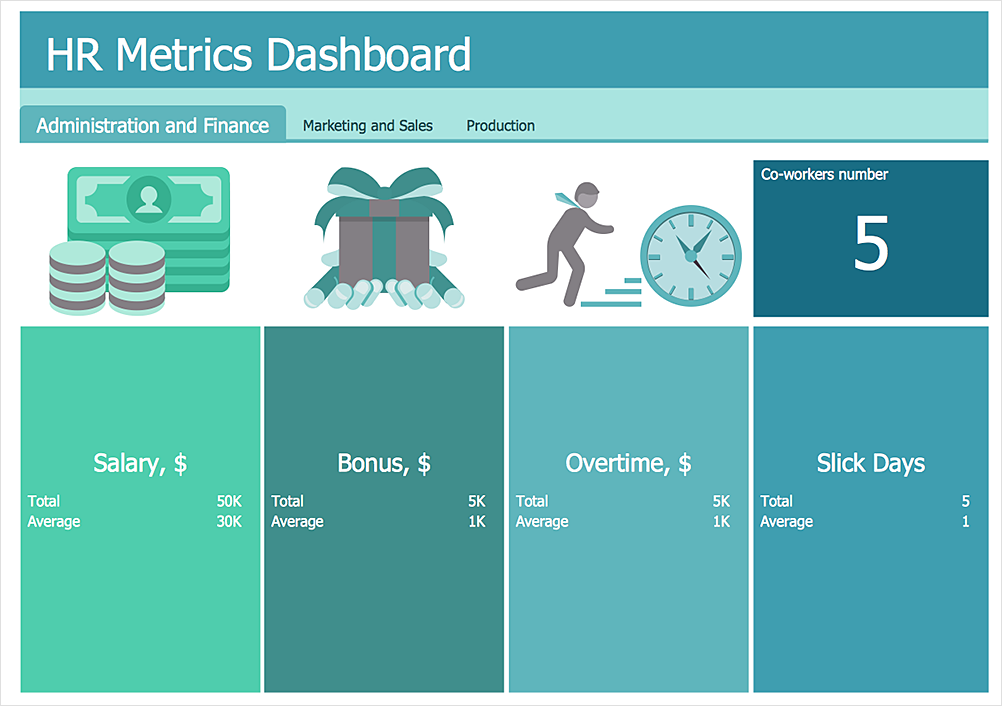
How To Create an HR Metric Dashboard
Human Resources dashboards can be used for analyzing hr workflow in an organization and identifying points for improvement. They are useful to HR managers, and for C level executives. HR dashboard helps to monitor HR KPIs. Thus Decision makers will ensure that company strategy is aligned from an executive, to managerial, to individual goals. HR Dashboard Solution for ConceptDraw DIAGRAM allows you to see what information you need from each KPI to see if your Human Resources management performs accurate and cost-efficient.
 IDEF Business Process Diagrams
Use the IDEF Business Process Diagrams solution to create effective database designs and object-oriented designs, following the integration definition methodology.
UML Flowchart Symbols
The UML diagram is a powerful tool which lets visually represent all system's components, the interactions between them and relationships with external user interface. The Rapid UML solution for ConceptDraw DIAGRAM software offers diversity of UML flowchart symbols for drawing all types of UML diagrams.
 Australia Map
For graphic artists creating accurate maps of Australia. The Australia Map solution - allows designers to map Australia for their needs, offers a collection of scalable graphics representing the political geography of Australia, split into distinct state
 Landscape & Garden
The Landscape and Gardens solution for ConceptDraw DIAGRAM is the ideal drawing tool when creating landscape plans. Any gardener wondering how to design a garden can find the most effective way with Landscape and Gardens solution.
 Basic Floor Plans
Detailed floor plan is the basis of any building project, whether a home, office, business center, restaurant, shop store, or any other building or premise. Basic Floor Plans solution is a perfect tool to visualize your creative projects, architectural and floor plans ideas.
 Business Package for Management
Package intended for professional who designing and documenting business processes, preparing business reports, plan projects and manage projects, manage organizational changes, prepare operational instructions, supervising specific department of an organization, workout customer service processes and prepare trainings for customer service personal, carry out a variety of duties to organize business workflow.
Business Process Workflow Diagram
Business Process Workflow Diagram is a professional visual tool that is widely applied for business development, business analysis, business process optimization and documenting business processes. Business Process Workflow Diagram lets depict in details the steps of business processes and flow of tasks between them, the execution of business processes, transfer of data and documents. The workflows on the Business Process Workflow Diagram are represented using the set of common symbols which let easy illustrate business processes and process flows, depict the start, all major steps and end of the process, what data are used by the process, how the data flow through the business areas within scope of our project, how the tasks are executed and by who, and how workers interact with each other.
- Value Chain Template Excel
- Value Stream Mapping Template Xls
- Value Chain Analysis Template
- Value Chain Template Xls
- ConceptDraw Dashboard for Facebook | Vsm Template Xls
- Fishbone Diagram Template Xls
- Download Template For Excell
- SWOT Matrix Template | Pert Chart Template Xls
- VSM Template | Value Stream Mapping Template | Value stream ...
- Swot Analysis Program Xls


