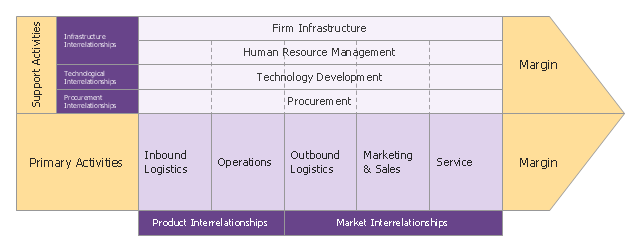
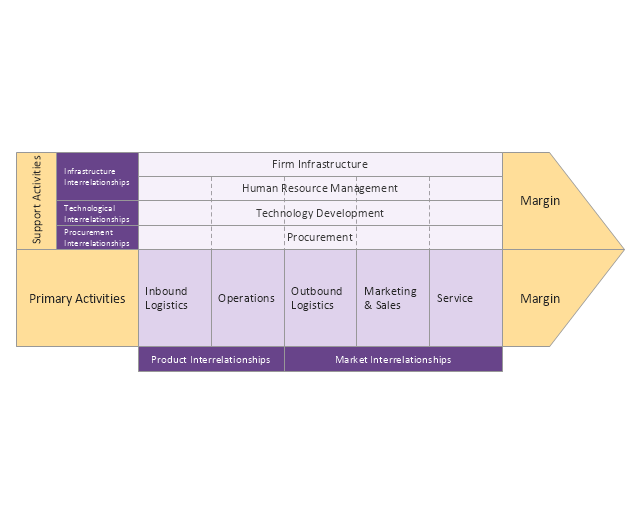
Porter's Value Chain

Matrices

 Matrices
This solution extends ConceptDraw PRO software with samples, templates and library of design elements for drawing the business matrix diagrams.
 Marketing Diagrams
Marketing Diagrams solution extends ConceptDraw PRO diagramming software with abundance of samples, templates and vector design elements intended for easy graphical visualization and drawing different types of Marketing diagrams and graphs, including Branding Strategies Diagram, Five Forces Model Diagram, Decision Tree Diagram, Puzzle Diagram, Step Diagram, Process Chart, Strategy Map, Funnel Diagram, Value Chain Diagram, Ladder of Customer Loyalty Diagram, Leaky Bucket Diagram, Promotional Mix Diagram, Service-Goods Continuum Diagram, Six Markets Model Diagram, Sources of Customer Satisfaction Diagram, etc. Analyze effectively the marketing activity of your company and apply the optimal marketing methods with ConceptDraw PRO software.
Deployment Chart Software

Business Tools Perceptual Mapping

Growth-Share Matrix Software

 Event-driven Process Chain Diagrams
Event-driven Process Chain (EPC) Diagram is a type of flowchart widely used for modeling in business engineering and reengineering, business process improvement, and analysis. EPC method was developed within the Architecture of Integrated Information Systems (ARIS) framework.
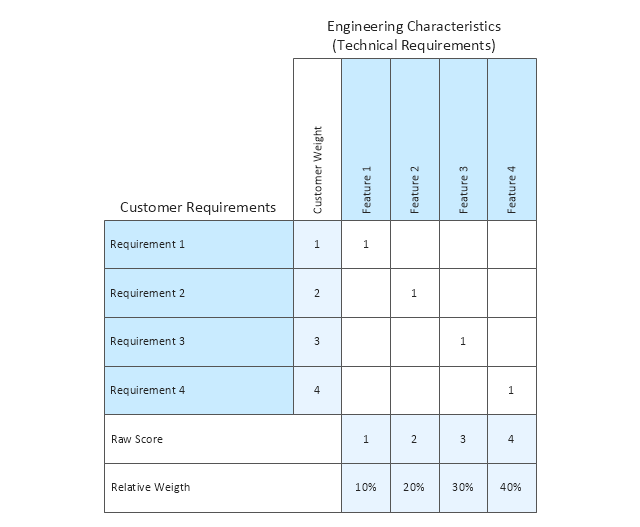
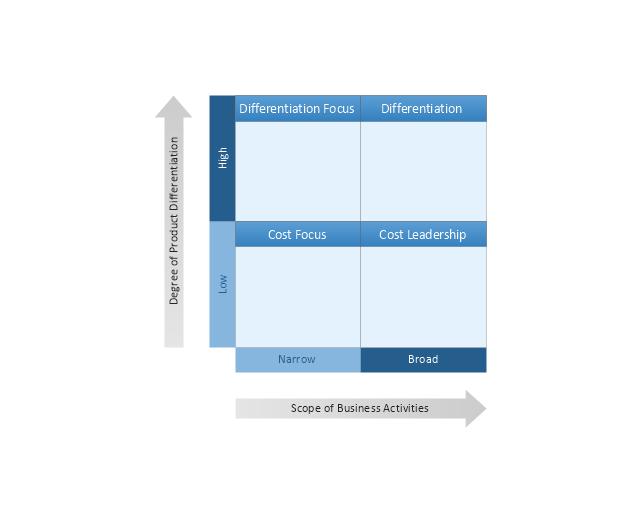
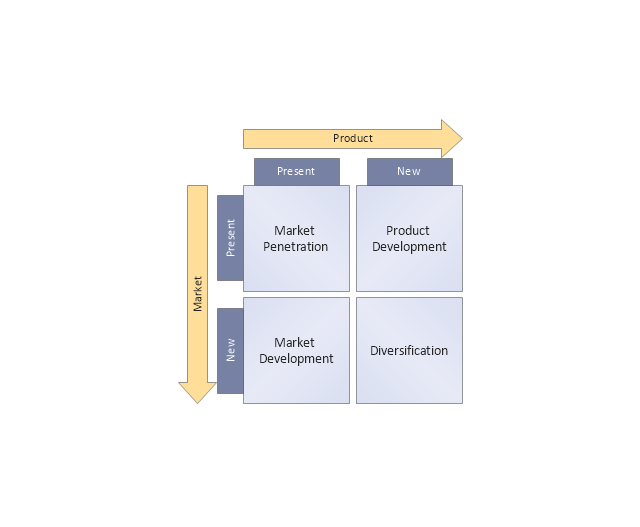
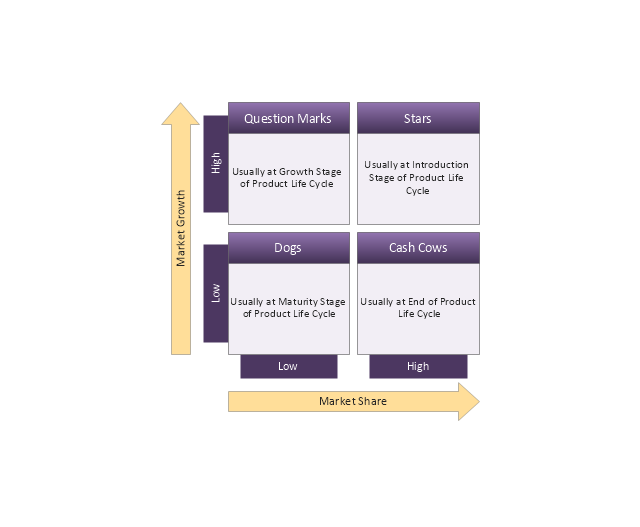
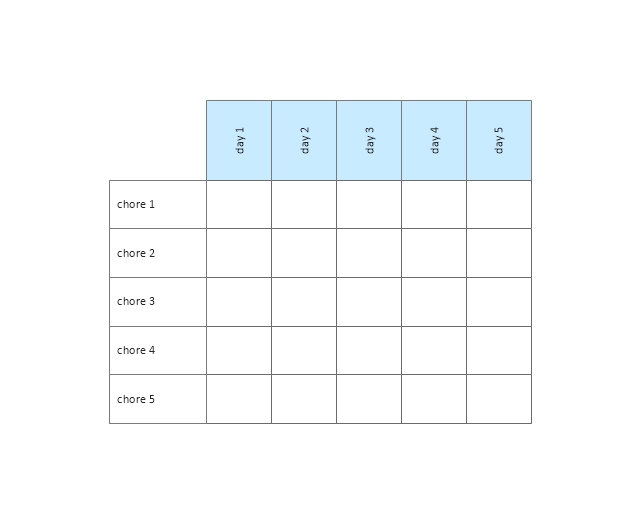
The vector stencils library "Matrices" contains 10 templates of marketing matrix diagrams and charts.
Use these templates to create your marketing matrices in the ConceptDraw PRO diagramming and vector drawing software extended with the Matrices solution from the Marketing area of ConceptDraw Solution Park.
Use these templates to create your marketing matrices in the ConceptDraw PRO diagramming and vector drawing software extended with the Matrices solution from the Marketing area of ConceptDraw Solution Park.
Quality function deployment matrix
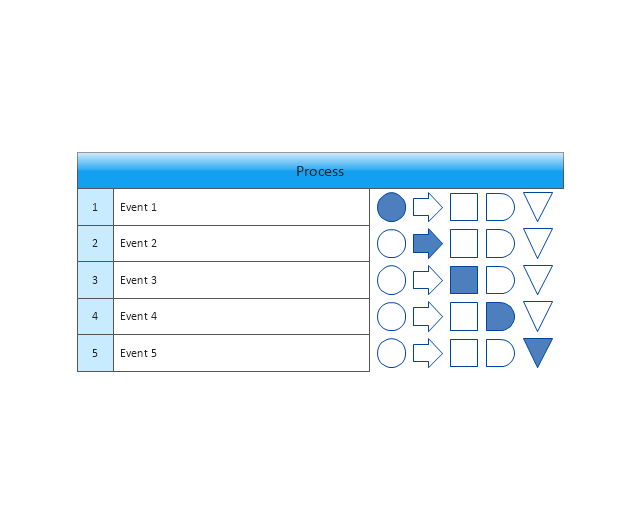
Flow process chart
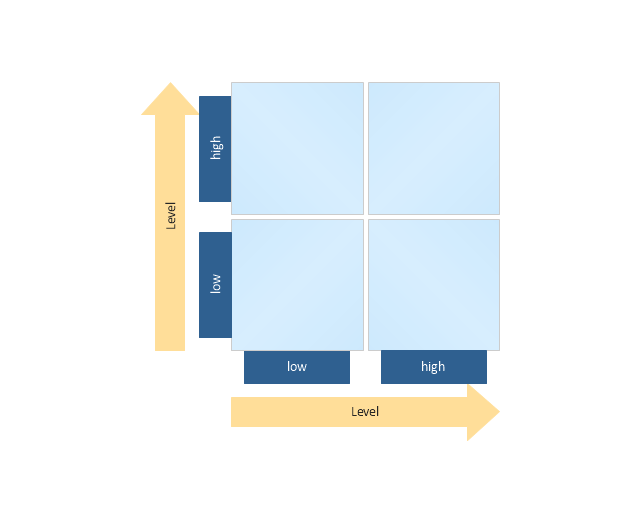
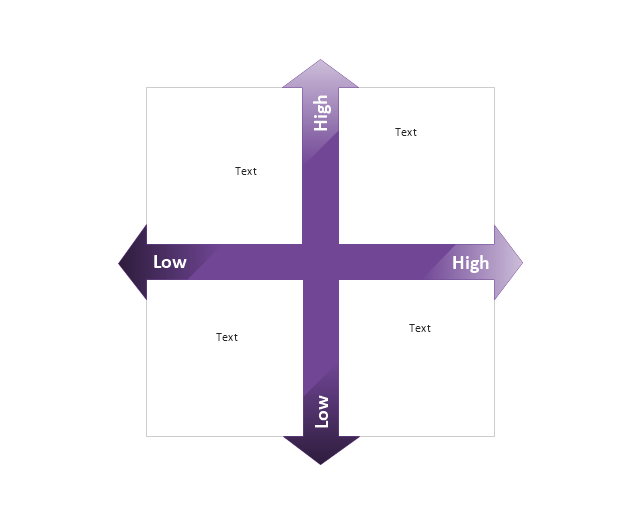
Four-quadrant matrix
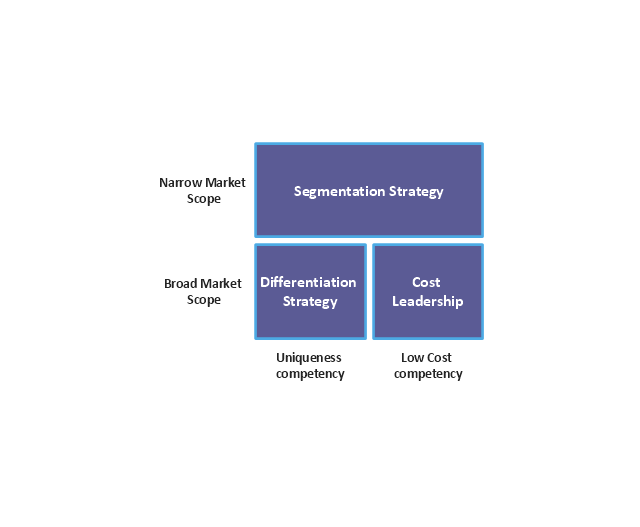
Competitive strategies matrix
Ansoff matrix
BCG matrix
Chore chart
Porter's value chain diagram
Positioning map
Porter's generic strategies matrix
 ConceptDraw Solution Park
ConceptDraw Solution Park collects graphic extensions, examples and learning materials
Process Flowchart


 Pie Charts
Pie Charts are extensively used in statistics and business for explaining data and work results, in mass media for comparison (i.e. to visualize the percentage for the parts of one total), and in many other fields. The Pie Charts solution for ConceptDraw PRO v10 offers powerful drawing tools, varied templates, samples, and a library of vector stencils for simple construction and design of Pie Charts, Donut Chart, and Pie Graph Worksheets.
 Block Diagrams
Block diagrams solution extends ConceptDraw PRO software with templates, samples and libraries of vector stencils for drawing the block diagrams.
- Porter's value chain matrix diagram
- Porter's value chain diagram - Template | SWOT analysis matrix ...
- Porter's Value Chain | | Matrices | Draw The Digram Of Porters ...
- Porter's Value Chain | Porter's value chain matrix diagram | Matrices ...
- Marketing Matrix Diagram Porters Value Chain
- Porter's generic strategies matrix diagram | Competitive strategy ...
- Porter's value chain matrix diagram
- Porter's value chain diagram - Template | Block diagram - Porter's ...
- Diagram Of Information Management Value Chain
- Porter's value chain matrix diagram | Event-driven Process Chain ...
- | Porter's Value Chain | | Porter S Value Chain
- How To Draw Value Chain Diagram In Word
- Porter's value chain matrix diagram | Enterprise Architecture ...
- Porter Value Chain Model Diagram Template
- Porter's value chain diagram - Template
- Porter's value chain matrix diagram | Matrices | Design elements ...
- Porter's value chain matrix diagram | SWOT Analysis | Mind Maps for ...
- Porter's value chain matrix diagram | What is SWOT Analysis ...
- Porter's value chain matrix diagram | Process Flowchart | Inbound ...
- Block diagram - Porter's five forces model | Porter's value chain ...