 CRM Center Dashboard
The CRM Center Dashboard solution extends ConceptDraw PRO v10 functionality with CRM software tools, large collection of CRM Charts live objects, CRM icons, CRM indicators, CRM maps and navigation elements, the set of professionally designed CRM samples and templates to help you construct your own CRM Dashboards and CRM Center Dashboards in a few minutes, to depict the current and actual data by connecting or refreshing the data source file. The customer management software ConceptDraw PRO makes you free to choose the style for your dashboard and to regulate the quantity of clipart on the diagram according to your taste.
 Value Stream Mapping
Value stream mapping solution extends ConceptDraw PRO software with templates, samples and vector stencils for drawing the Value Stream Maps (VSM) in lean manufacturing practice.
Best Value Stream Mapping mac Software
Create value stream maps - for value stream analysis and value stream management, material and information flow mapping, using our quick start templates included with ConceptDraw.Value Stream Maps Visualize
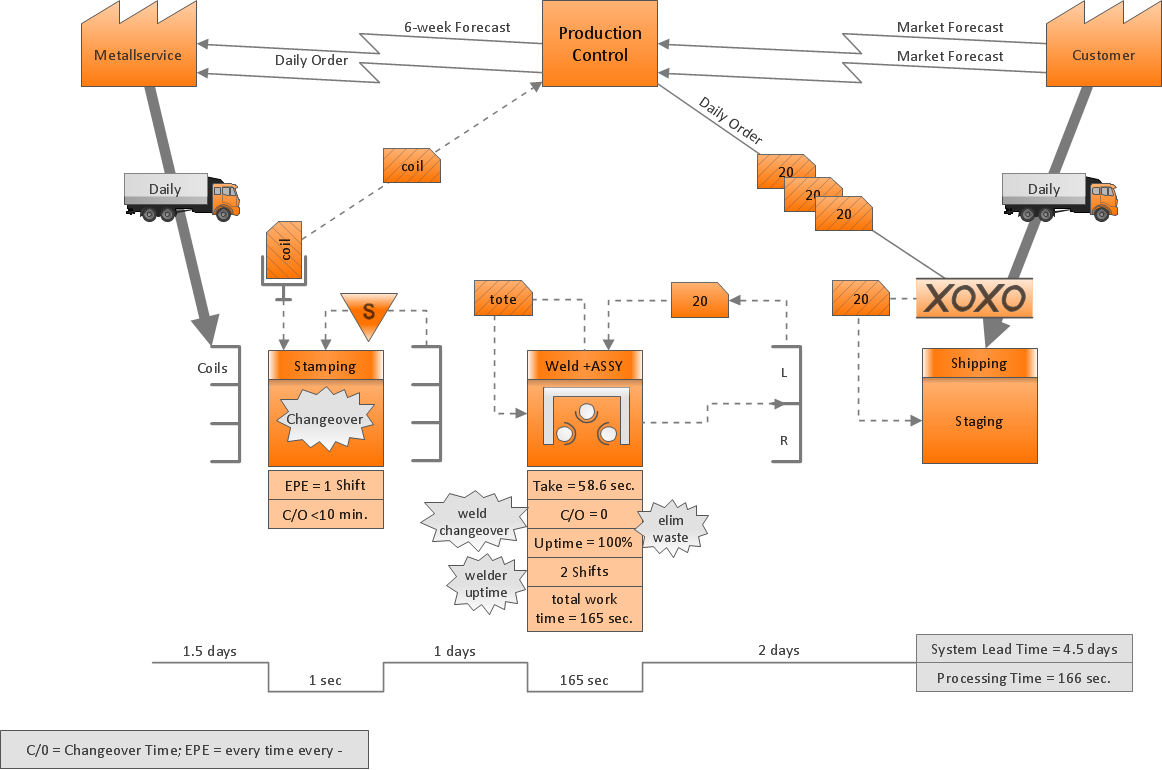
ConceptDraw Value Stream Maps visualize for a manufacturing plant the material and information flow.Total Quality Management Value
The Total quality management (TQM) is an enterprise-wide method of continuous quality improvement of all organizational processes, including the enhancement of ability to deliver high-quality products and services to the customers. The TQM includes eight main elements, which have great value: customer-focused, process-centered, total employee involvement, integrated system, continual improvement, strategic and systematic approach, fact-based decision making, communications. ConceptDraw PRO diagramming and vector drawing software offers the Total Quality Management Diagram solution with effective drawing tools, predesigned vector elements, samples and templates that help easy design the Total Quality Management diagrams, TQM flowcharts and Mind Maps widely used in quality management projects to visualize the business processes and industrial processes for your organization, to demonstrate the quality control step-by-step in a visual manner, to compare visually the ideal and real stages of processes.Value Stream Management
The Value Stream Mapping solution found in the ConceptDraw Solution Park continues to extend the range of ConceptDraw PRO v9 into a business graphics tool that can be used to document processes in any organization.Value Stream Mapping Symbols
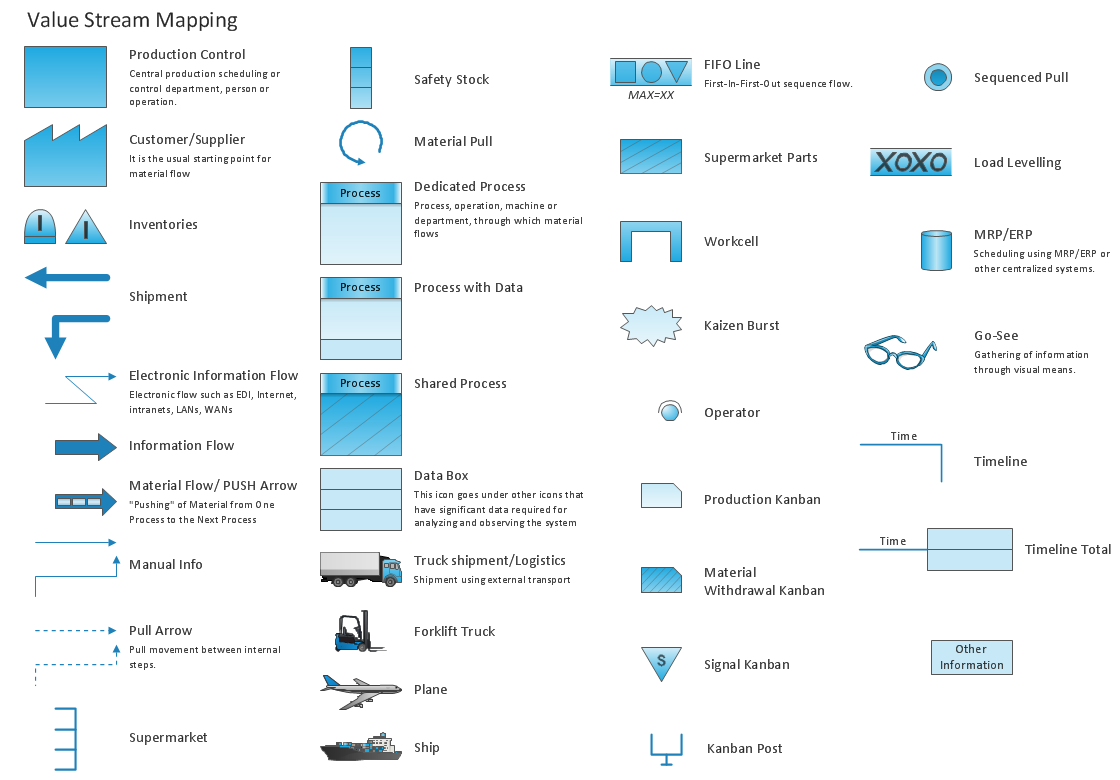
VSM symbols are the best for a production process designing. The entire Value Stream Mapping method uses a graphical representation of the manufacturing process, factors' pros and cons, that all stakeholders can easily understand. Value Stream Mapping is a graphical technique that provides possibilities to improve analysis of a manufacturing process, at the stage of the transferring information or materials that required to deliver a product or service to the customer.- Value Stream Mapping For Customer Service
- ConceptDraw | Press Releases
- ConceptDraw | Press Releases
- Major Milestone: CS Odessa Makes 2014 “Software Magazine” 500 ...
- Competitor Analysis | Total Quality Management Value | Matrices ...
- Value Stream Data For Customer Services
- Ishikawa Customer Service
- ConceptDraw | Press Releases
- Customer Support Process Flow Chart
- Example Of Flow Chart On Customer Service


