The vector stencils library "Value stream mapping" contains 43 VSM symbols.
Use it for drawing value stream maps in the ConceptDraw PRO diagramming and vector drawing software extended with the Value Stream Mapping solution from the Quality area of ConceptDraw Solution Park.
www.conceptdraw.com/ solution-park/ business-value-stream-mapping
Use it for drawing value stream maps in the ConceptDraw PRO diagramming and vector drawing software extended with the Value Stream Mapping solution from the Quality area of ConceptDraw Solution Park.
www.conceptdraw.com/ solution-park/ business-value-stream-mapping
Inventory
Inventory

Information Flow
Shipment
Shipment
Material Flow
Material Pull

FIFO Line
Truck shipment/Logistics
Customer/Supplier
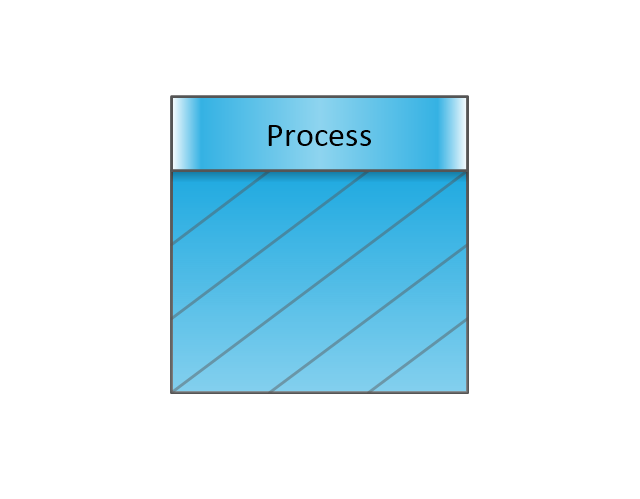
Dedicated Process

Shared Process
Supermarket Parts
Data Box
Workcell
Kaizen Burst

Operator

Other
Production Control
Manual Info
Electronic Information Flow
Production Kanban
Withdrawal Kanban

Signal Kanban
Kanban Post

Sequenced Pull
Load Levelling

MRP/ERP
Go-See
Pull Arrow
Manual Info
Pull Arrow
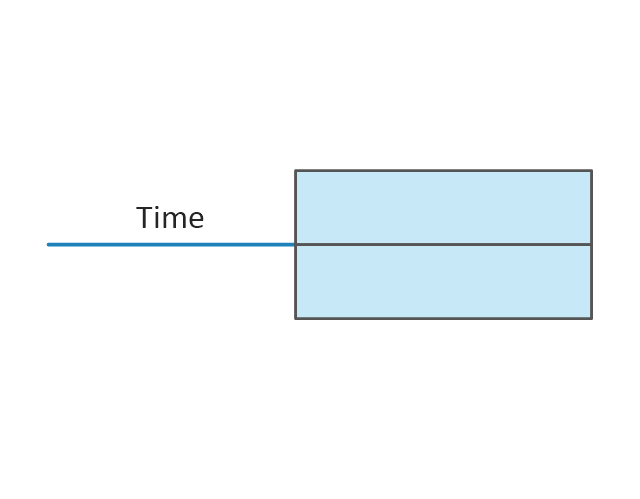
Timeline Total
Ship
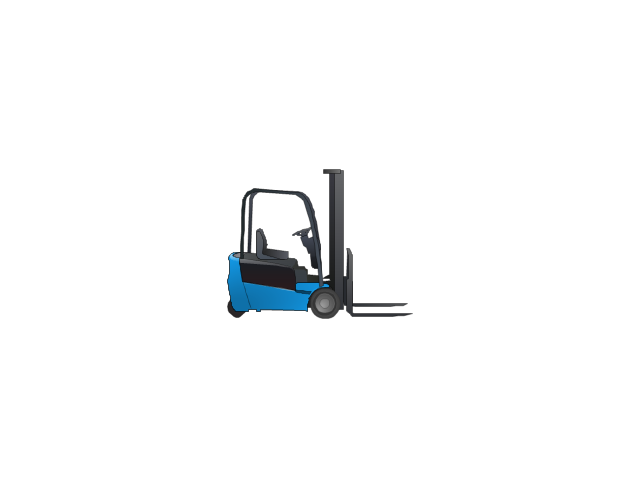
Forklift Truck
Plane

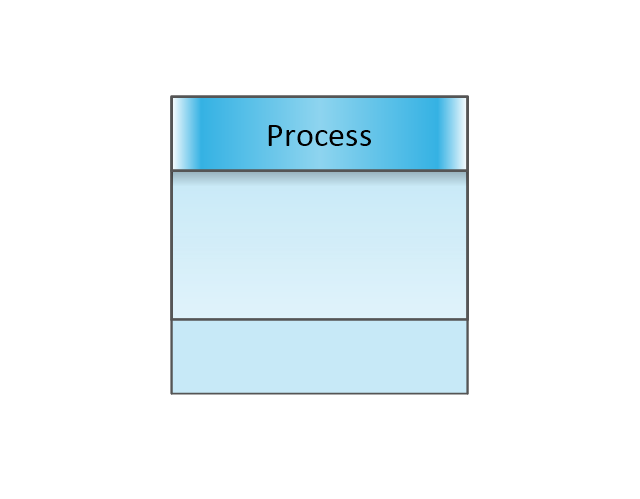
Process with Data
Timeline
Timeline
Supermarket, 2

Supermarket, 3

Safety stock, 2
Safety stock, 3
"Value Stream Map (VSM)
1. A tool used to improve a process by identifying added value and eliminating waste.
2. A process map that follows the value creation process.
A. “strap yourself to the product (or service) and see where you go”
3. A process map with data added.
A. Times: processing, wait, cycle.
B. Quality: number of rejects.
C. Inventory.
D. Resources.
1) Number of people.
2) Space.
3) Distance traveled.
E. Whatever else is useful for analyzing the process." [ocw.mit.edu/ courses/ aeronautics-and-astronautics/ 16-660j-introduction-to-lean-six-sigma-methods-january-iap-2012/ lecture-notes/ MIT16_ 660JIAP12_ 1-6.pdf]
This sample VSM flowchart shows the value stream in a manufacturing, production control and shipping processes.
This value stream mapping diagram example was created using the ConceptDraw PRO diagramming and vector drawing software extended with the Value Stream Mapping solution from the Quality area of ConceptDraw Solution Park.
Value stream mapping

Value stream with ConceptDraw PRO

"Value Stream Map (VSM)
1. A tool used to improve a process by identifying added value and eliminating waste.
2. A process map that follows the value creation process.
A. “strap yourself to the product (or service) and see where you go”
3. A process map with data added.
A. Times: processing, wait, cycle.
B. Quality: number of rejects.
C. Inventory.
D. Resources.
1) Number of people.
2) Space.
3) Distance traveled.
E. Whatever else is useful for analyzing the process." [ocw.mit.edu/ courses/ aeronautics-and-astronautics/ 16-660j-introduction-to-lean-six-sigma-methods-january-iap-2012/ lecture-notes/ MIT16_ 660JIAP12_ 1-6.pdf]
This sample VSM flowchart shows the value stream in a manufacturing, production control and shipping processes.
This value stream mapping diagram example was created using the ConceptDraw PRO diagramming and vector drawing software extended with the Value Stream Mapping solution from the Quality area of ConceptDraw Solution Park.
1. A tool used to improve a process by identifying added value and eliminating waste.
2. A process map that follows the value creation process.
A. “strap yourself to the product (or service) and see where you go”
3. A process map with data added.
A. Times: processing, wait, cycle.
B. Quality: number of rejects.
C. Inventory.
D. Resources.
1) Number of people.
2) Space.
3) Distance traveled.
E. Whatever else is useful for analyzing the process." [ocw.mit.edu/ courses/ aeronautics-and-astronautics/ 16-660j-introduction-to-lean-six-sigma-methods-january-iap-2012/ lecture-notes/ MIT16_ 660JIAP12_ 1-6.pdf]
This sample VSM flowchart shows the value stream in a manufacturing, production control and shipping processes.
This value stream mapping diagram example was created using the ConceptDraw PRO diagramming and vector drawing software extended with the Value Stream Mapping solution from the Quality area of ConceptDraw Solution Park.
Value stream mapping
Business Processes description with ConceptDraw PRO

 Marketing Diagrams
This solution extends ConceptDraw PRO with samples, templates and library of design elements for drawing the marketing diagrams.
 Computer Network Diagrams
Computer Network Diagrams solution extends ConceptDraw PRO software with samples, templates and libraries of vector stencils for drawing the computer network topology diagrams.
Create Sophisticated Professional Diagrams - Simply

 Azure Architecture
Azure Architecture solution bundles into one handy tool everything you need to create effective Azure Architecture diagrams. It adds the extra value to versatile ConceptDraw PRO software and extends the users capabilities with comprehensive collection of Microsoft Azure themed graphics, logos, preset templates, wide array of predesigned vector symbols that covers the subjects such as Azure management, Azure storage, and Azure services, amongst others, and allow you to illustrate Azure Architecture diagrams at any degree of complexity, to present visually your Azure cloud system architecture with professional style, to design Azure cloud topology, to document Windows Azure Architecture and Azure Cloud System Architecture, to visualize the great abilities and work of Microsoft Azure Cloud System and Azure services.
 Rapid UML
Rapid UML solution extends ConceptDraw PRO software with templates, samples and libraries of vector stencils for quick drawing the UML diagrams using Rapid Draw technology.
Business Processes

Waterfall Bar Chart

- Conceptual diagram of the Kanban System | Value stream mapping ...
- Value Stream Mapping Information Control
- Value Stream Mapping Symbols
- What is Value Stream Mapping ? | Total Quality Management Value ...
- Value Stream Mapping Production Control
- Value stream mapping - Vector stencils library
- Value Stream Mapping Shipping
- Material Requisition Flowchart. Flowchart Examples | Value stream ...
- Supermarket parking | Value stream mapping - Vector stencils ...
- How Do Fishbone Diagrams Solve Manufacturing Problems | Value ...
- Value stream mapping diagram
- Value stream with ConceptDraw PRO | Value Stream Mapping | Best ...
- Payroll process - Swim lane process mapping diagram | Design ...
- Value Stream Mapping | ConceptDraw Solution Park | Cisco LAN ...
- Manufacturing and Maintenance | How Do Fishbone Diagrams ...
- How to Create a Gantt Chart for Your Project | Value stream map ...
- Value stream mapping diagram
- Value Stream Mapping Icons | Cloud round icons - Vector stencils ...
- Conceptual diagram of the Kanban System | Kanban Board ...
- Process Flowchart | Basic Flowchart Symbols and Meaning | Flow ...