Venn Diagram Examples for Problem Solving. Environmental Social Science. Human Sustainability Confluence
The Venn diagram example below shows sustainable development at the confluence of three constituent parts. Create your Venn diagrams for problem solving in environmental social science using the ConceptDraw DIAGRAM diagramming and vector drawing software extended with the Venn Diagrams solution from the area "Diagrams" of ConceptDraw Solution Park.Simple Drawing Applications for Mac
ConceptDraw gives the ability to draw simple diagrams like flowcharts, block diagrams, bar charts, histograms, pie charts, divided bar diagrams, line graphs, area charts, scatter plots, circular arrows diagrams, Venn diagrams, bubble diagrams, concept maps, and others.
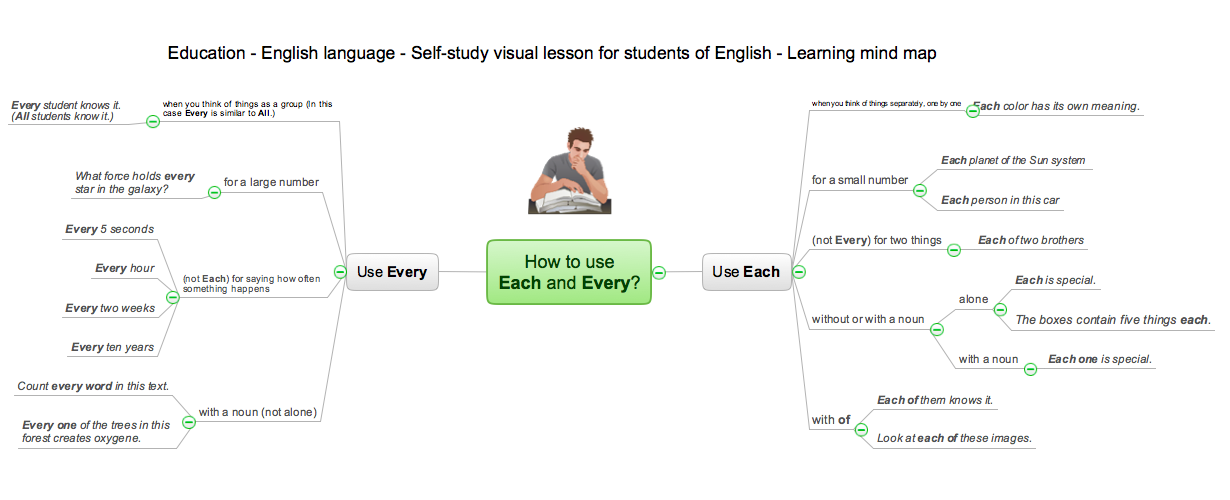
Language School E-Learning
E-Learning in Schools: Online Language Teaching tools. E-Learning software for remote presentations with Skype. Best practices for eLearning.
Cylinder Venn Diagram
You need design Cylinder Venn Diagram? Nothing could be easier with ConceptDraw DIAGRAM diagramming and vector drawing software extended with Venn Diagrams Solution from the “Diagrams” Area. ConceptDraw DIAGRAM allows you to design various Venn Diagrams including Cylinder Venn Diagrams.Basic Circles Venn Diagram. Venn Diagram Example
Venn Diagrams visualize all possible logical relations between several sets and are widely used in mathematics, logic, statistics, marketing, sociology, etc. This Venn Diagram shows the relative complement of the set A with respect to the set B. It is the set of the elements in B, but not in A. In other words it is the set-theoretic difference B-A.
Basic Venn Diagrams
This solution extends ConceptDraw DIAGRAM (or later) with samples, templates, and libraries of vector stencils for drawing Venn Diagrams.
Circle Diagrams
The Circle Diagrams are the diagrams which represent the central element surrounded by other items in a circle. This type of diagram is very popular and widely used in marketing and management, for process modeling, market, resource, time and cost analysis, for visualization causes and effects. If you dream to design the Circle Diagrams quick and easy – the ConceptDraw DIAGRAM software extended with Circle-Spoke Diagrams Solution from the "Diagrams" Area is exactly what you need.
Business Diagrams
The Business Diagrams Solution extends ConceptDraw DIAGRAM with an extensive collection of professionally designed illustrative samples and a wide variety of vector stencils libraries, which are the real help for all business-related people, business analysts, business managers, business advisers, marketing experts, PR managers, knowledge workers, scientists, and other stakeholders allowing them to design the bright, neat, expressive and attractive Bubble Diagrams, Circle-Spoke Diagrams, Circular Arrows Diagrams, and Venn Diagrams with different quantity of sets in just minutes; and then successfully use them in documents, reports, statistical summaries, and presentations of any style.
Circles Venn Diagram
This example shows the 4 Circle Venn Diagram. The Venn Diagram visualizes all possible logical relations between several sets. The sets are represented as circles on the Venn Diagram. On this example you can see the intersections of 4 sets. Venn Diagrams are widely used in mathematics, logic, statistics, marketing, sociology, etc.Basic Audit Flowchart. Flowchart Examples
This sample shows the Audit Process Flowchart. It was created in ConceptDraw DIAGRAM diagramming and vector drawing software using the Flowcharts solution from the Diagrams area of ConceptDraw Solution Park. The Audit Flowcharts are widely used in the financial management, accounting, money management and in many others fields.- Venn Diagram In Social Mapping
- Venn Diagram Examples for Problem Solving. Environmental Social ...
- Social determinants of health | Venn Diagram Examples for Problem ...
- Path to sustainable development | Venn Diagram Examples for ...
- Venn Diagram Examples for Problem Solving. Environmental Social ...
- Circle-Spoke Diagrams | Bubble Diagrams | Social Determinants Of ...
- Venn Diagram Examples for Problem Solving. Environmental Social ...