 Fishbone Diagram
Fishbone Diagrams solution extends ConceptDraw PRO software with templates, samples and library of vector stencils for drawing the Ishikawa diagrams for cause and effect analysis.
Ishikawa Diagram
In almost every sphere of life and work the people time to time are faced with the fact that on their way there are certain obstacles and problems. But it is not always possible to identify the true cause of particular problem. To understand the basic causes of problems and eliminate them, it is convenient to use the chart of Kaoru Ishikawa - the technique specially designed for this. ConceptDraw PRO diagramming and vector drawing software extended with Fishbone Diagrams solution from the Management area can help you with construction the Fishbone Diagram also known as Ishikawa Diagram. Ishikawa Diagram shows factors of Equipment, Process, People, Materials, Environment and Management, all affecting the overall problem in one drawing for the further analysis. It is a well effective way to analyze the business problems you must identify and solve.
 HR Flowcharts
Human resource management diagrams show recruitment models, the hiring process and human resource development of human resources.
Fishbone Diagram Template
A causal model is an abstract concept, that describes the causal mechanisms of a system, by noting certain variables and their influence on each other, in an effort to discover the cause of a certain problem or flaw. This model is presented in diagram form by using a fishbone diagram. ConceptDraw PRO diagramming and vector drawing software enhanced with Fishbone Diagrams solution helps you create business productivity diagrams from Fishbone diagram templates and examples, that provide to start using of the graphic method for the analysis of problem causes. Each predesigned Fishbone Diagram template is ready to use and useful for instantly drawing your own Fishbone Diagram.BPM Software
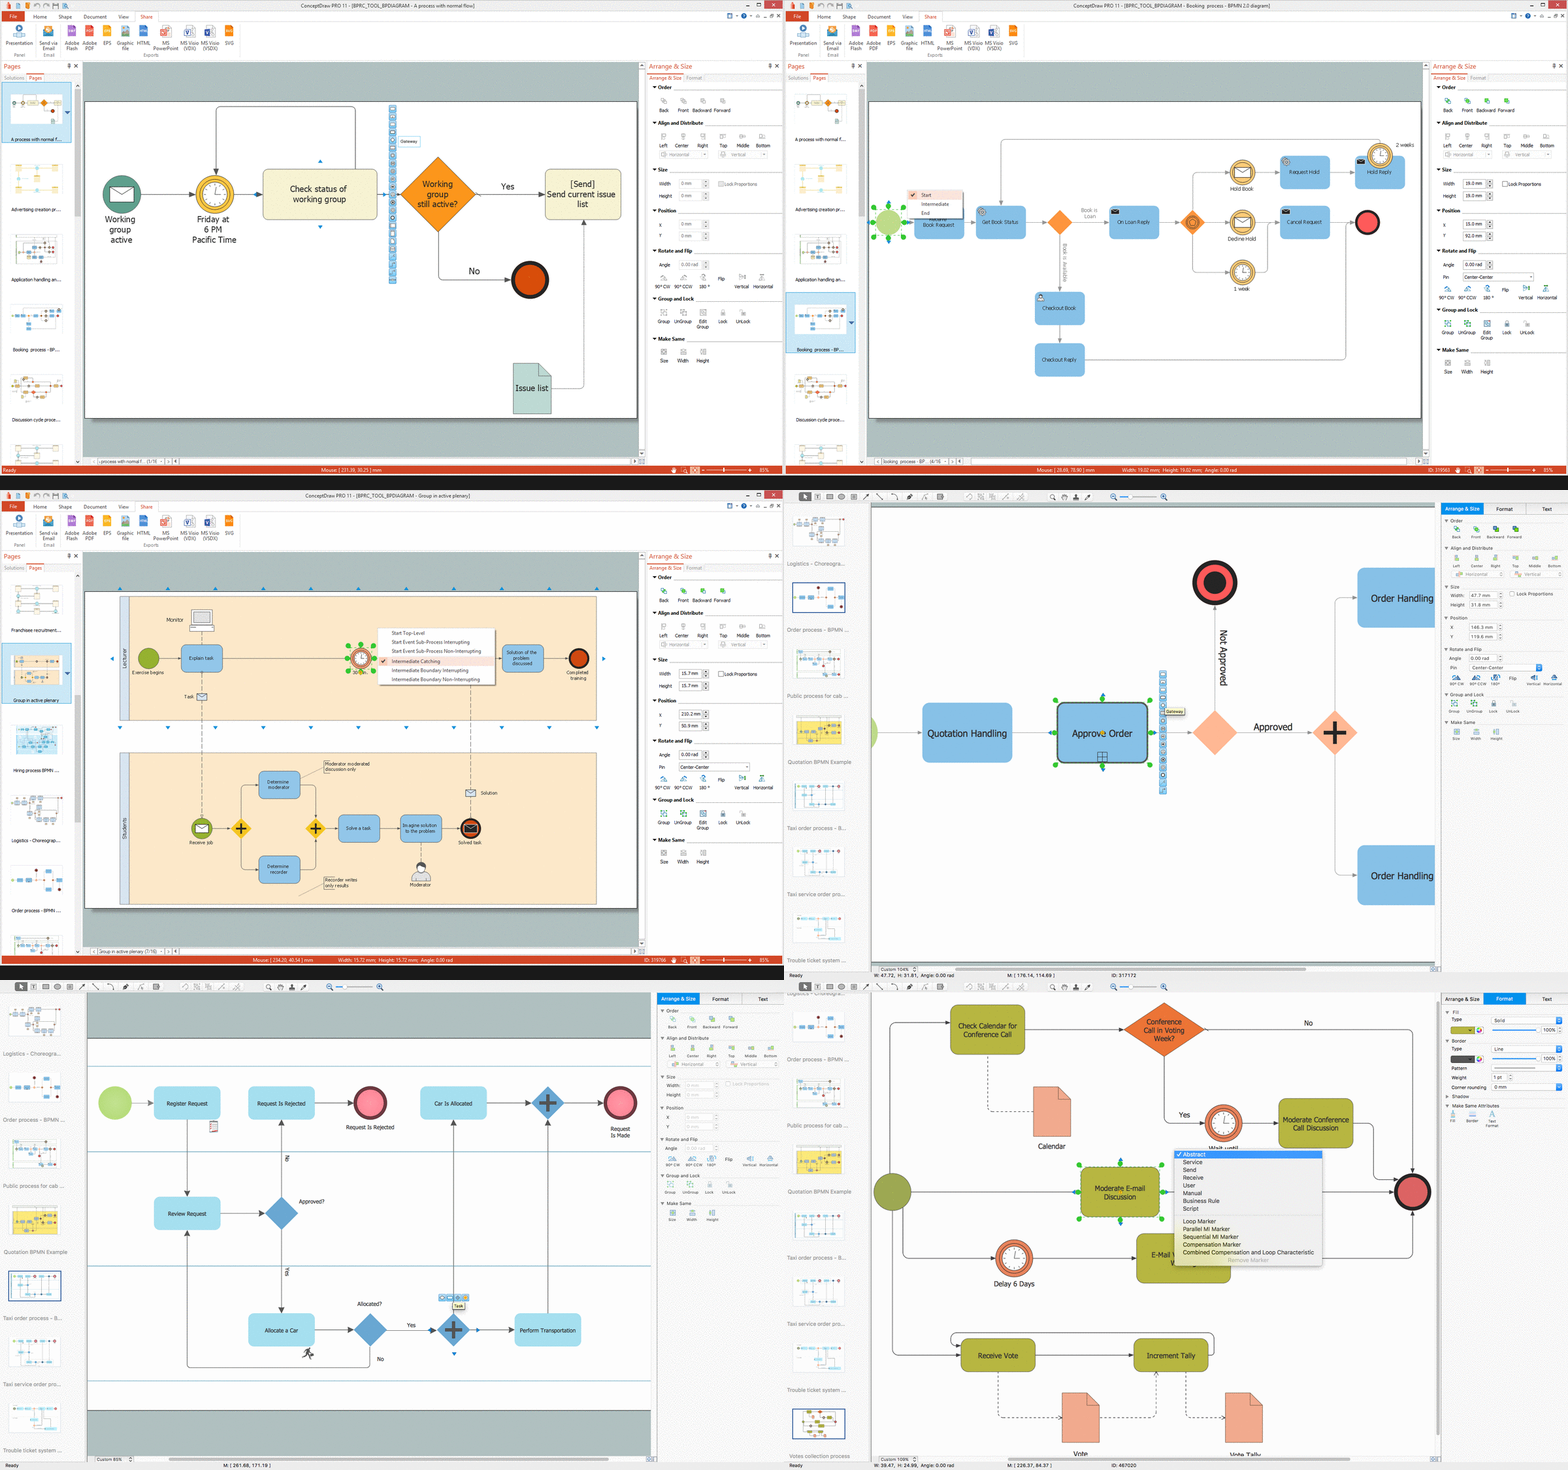
ConceptDraw PRO extended with Business Process Diagram Solution from the Business Processes Area is a powerful BPM Software which provides a set of useful drawing tools. Business Process Diagram Solution provides 16 libraries with wide variety of predesigned vector objects from BPMN 1.2 and BPMN 2.0, this is business process improvement tools.Porter's Value Chain
ConceptDraw PRO diagramming and vector drawing software offers you the Matrices Solution from the Marketing Area with extensive drawing tools for creating the Porter's Value Chain diagrams.Cyber Security Degrees
For protection various cyber environments are developed and applied large variety of cyber security standards, techniques, security concepts and approaches with different cyber security degrees. The ConceptDraw PRO diagramming and vector drawing software extended with Network Security Diagrams Solution from the Computer and Networks Area of ConceptDraw Solution Park offers the number of useful tools which will help network security engineers, cyber security specialists, network and computer analysts easily and visually depict the knowledge and skills for research and prevention of intrusions, about protection critical information and analysis of cyber incidents, and for how to assess threats and vulnerabilities.Examples of Flowcharts, Org Charts and More
ConceptDraw PRO covers a broad spectrum of business graphics categories and offers at ConceptDraw STORE enormous online collection of pictorial examples and samples for different thematics and application areas. It is a plentiful source of inspiration and wonderful examples of professionally designed diagrams, flowcharts, UML diagrams, organizational charts, databases, ERDs, network diagrams, business charts, different thematic charts, schematics, infographics and plans developed specially for knowledge workers, engineers, managers, businessmen, marketing specialists, analytics, scientists, students, professors, journalists and also for a large number of other people that every day use various diagrams and drawings in their work and life activity. Each of these examples is a real art, all they are well thought-out and designed without efforts with help of powerful tools of ConceptDraw PRO software. ConceptDraw examples display all variety of tasks, possibilities and results that ConceptDraw Product Line lets achieve fast and easy. ConceptDraw is one of the best Visio alternatives for Mac. It open all Visio formats like .vsdx, .vss, .vdx files and allows you to export files to Visio formats.
PDPC
ConceptDraw PRO extended with Seven Management and Planning Tools Solution from the Management Area of ConceptDraw Solution Park is the best software for drawing all types of diagrams from the Seven Management and Planning Tools: Affinity Diagram, Relations Diagram, Prioritization Matrix, Root Cause Analysis Tree Diagram, Involvement Matrix, PERT Chart, and Risk Diagram (PDPC).Azure Services
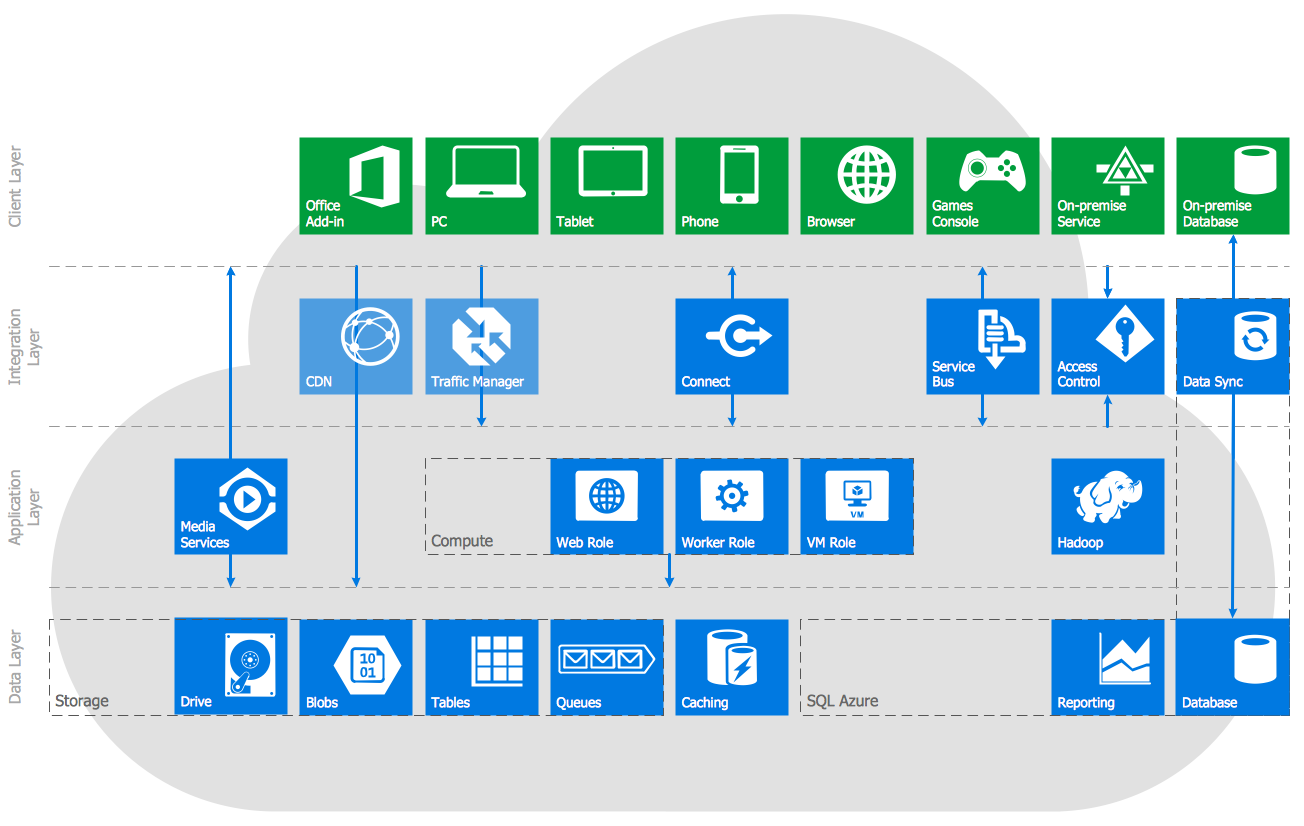
Azure is a cloud computing platform developed by Microsoft which offers the extensive infrastructure and wide set of integrated Azure services useful for effective computing, storage, analytics, databases, networking, application development and deployment. ConceptDraw PRO extended with Azure Architecture Solution from the Computer and Networks area is a powerful diagramming and vector drawing software with extensive set of useful drawing tools for easy creating Azure Architecture Diagrams and documenting Azure services.
 Bubble Diagrams
Bubble diagrams have enjoyed great success in software engineering, architecture, economics, medicine, landscape design, scientific and educational process, for ideas organization during brainstorming, for making business illustrations, presentations, planning, design, and strategy development. They are popular because of their simplicity and their powerful visual communication attributes.
Types of Flowchart - Overview
When designing a process or an instruction in clear and understandable way, you should consider creating a flowchart. You can avoid spending a lot of time understanding complex concepts as they get clear with different diagrams. The flowcharts are very popular diagram type, they are useful at different fields from the description business processes to the presentation of cooking recipes. Basic Flowchart, Business Process Modeling Diagram, Process Flowchart, Cross Functional Flowchart, Procedure Flowchart, Data Flow Diagram, IDEF Flowchart, SDL Diagram, Workflow Diagram, Document Flowchart, Program Flowchart, Value Stream Map, System Flowchart, Highlight Flowchart, Sales Flowchart are the main types flowchart. The ConceptDraw PRO is one of the professional applications which has great advantages and using which you can create different types of Flowcharts easy and fast. Try to draw an illustrative and comprehensible diagram in ConceptDraw PRO describing the processes instead of writing complex long text and make sure how it is convenient. Visio is expensive, and if you use it in a team environment, these costs are compounded. ConceptDraw PRO is an affordable alternative to Visio and luckily, it comes with a team plan. ConceptDraw PRO can import and export Visio files, so Mac users can collaborate with PC users stuck on Microsoft's software.
 Workflow Diagrams
Workflow Diagrams solution extends ConceptDraw PRO software with samples, templates and vector stencils library for drawing the work process flowcharts.
Bar Diagrams for Problem Solving. Create manufacturing and economics bar charts with Bar Graphs Solution
Create bar charts for visualizing problem solving in manufacturing and economics using the ConceptDraw PRO diagramming and vector drawing software extended with the Bar Graphs Solution from the Graphs and Charts area of ConceptDraw Solition Park.- How to Dramatically Reduce Drawing Time - New connection ...
- Transport Hazard Pictograms | Pyramid Diagram | Feature ...
- System Block Diagram Software Free
- Network Security Diagrams | Flow Diagrams On How To Reduce Or ...
- Business diagrams & Org Charts with ConceptDraw PRO | Basic ...
- Pyramid Diagram | Pyramid Diagram and Pyramid Chart | Pyramid ...
- BCG Matrix | Growth-Share Matrix Software | Pyramid Diagram ...
- AWS Architecture Diagrams | AWS | AWS Simple Icons for ...
- Process Flowchart | Internal Audit Process | Basic Flowchart ...
- How To Draw Flow Diagram In Geography
- Basic Diagramming | Block Diagrams | Create Block Diagram | Basic ...
- FTA diagram - Hazard analysis | Accident analytic tree - FTA ...
- FTA diagram - Hazard analysis | Design elements - Fault tree ...
- Software for Creating SWOT Analysis Diagrams | SWOT Matrix ...
- Cost Management Process Flow Chart
- ( BCG ) matrix diagram
- SWOT Matrix Template | Swot Analysis Examples | SWOT Analysis ...
- Business Schematic Diagram Software
- Business diagrams & Org Charts with ConceptDraw PRO | How To ...


