 What are Infographic Area
Solutions of the area What is Infographics from ConceptDraw Solution Park collect templates, samples and vector stencils libraries with design elements for the drawing information graphics.
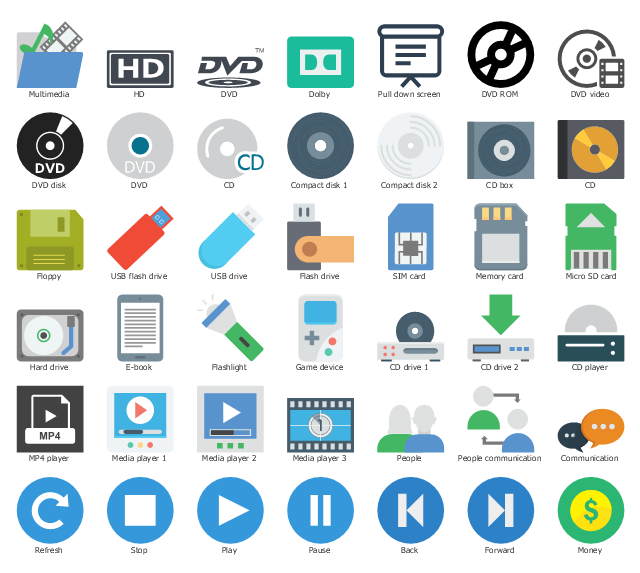
The vector stencils library "Media" contains 42 multimedia icons.
Use it to design your audio, video and multimedia illustrations, presentations, web pages and infographics with ConceptDraw PRO diagramming and vector drawing software.
"Multimedia is content that uses a combination of different content forms such as text, audio, images, animation, video and interactive content. ...
Multimedia can be recorded and played, displayed, dynamic, interacted with or accessed by information content processing devices, such as computerized and electronic devices, but can also be part of a live performance. Multimedia devices are electronic media devices used to store and experience multimedia content." [Multimedia. Wikipedia]
The clipart example "Media" is included in the Audio, Video, Media solution from the Illustrations area of ConceptDraw Solution Park.
Sample Project Flowchart. Flowchart Examples
This sample shows the Flowchart that displays the architecture of SQL Exception Translation. This sample was created in ConceptDraw PRO diagramming and vector drawing software using the Flowcharts solution from the What is a Diagram area of ConceptDraw Solution Park.
HelpDesk
How to Connect Text Data to a Time Series Chart on Your Live Dashboard
Time Series Dashboard means an integration of some type of diagrams: Line Charts, Bar Charts, Column Charts, and Dot Plots on a single space. The ConceptDraw Time Series Dashboard solution can be used to create the interactive Time Series dashboard. The libraries of Time Series Charts solution contain the Live Objects, that can change their appearance depending on the external data. Each chart from the Time Series dashboard displays particular source data. You can include Time Series Charts in your business or technical dashboards to show and compare the items changing over time.
HelpDesk
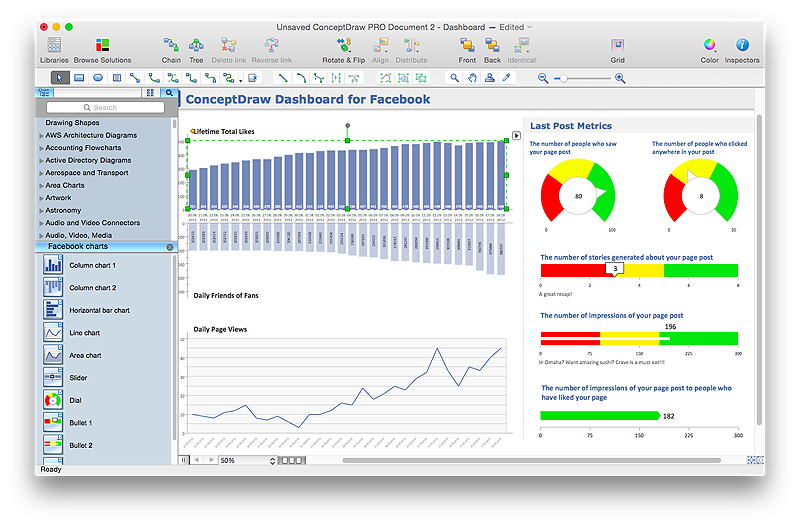
How to Use ConceptDraw Dashboard for Facebook on OS X
The ConceptDraw Dashboard for Facebook Solution is a visual dashboard that visualizes lifetime total Likes, daily Friends of Fans, and daily Page views based on the information exported from your Facebook Page.HelpDesk
How to Connect a Live Object to a Text Data Source
Instruction on how to connect a ConceptDraw live object with data source files in TXT format to visualize the actual values of your performance metrics.
 Histograms
How to make a Histogram? Making a Histogram is an incredibly easy process when it is done with ConceptDraw PRO. The Histograms Solution enhances ConceptDraw PRO v10 functionality with extensive drawing tools, numerous samples, and examples; also a quick-start template and library of ready vector stencils for visualization the data and professional drawing Histograms.
HelpDesk
How to Create a Sales Dashboard Using ConceptDraw PRO
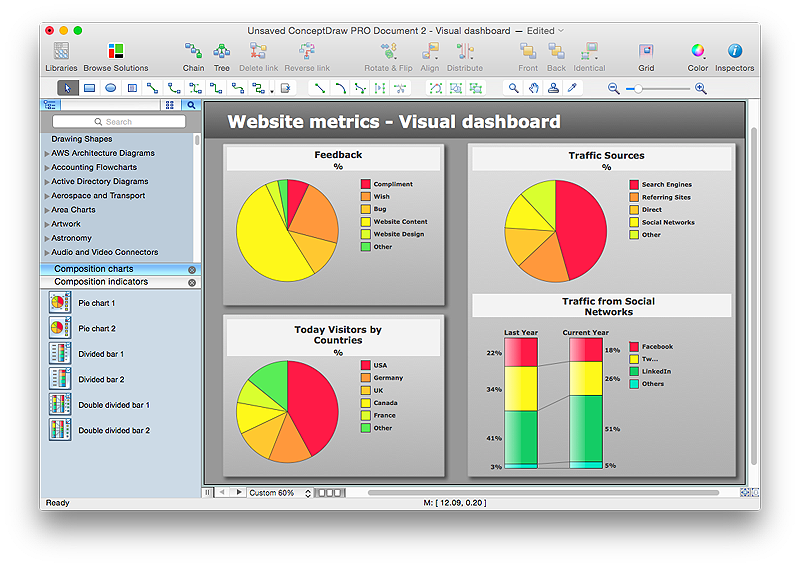
Visual dashboard is a valuable tool for any sales team. Sales dashboard allows you to view and monitor sales indicators that are important for manager and sales staff . It helps to use the timely and reliable information to improve the quality of sales performance and increase sales revenues. ConceptDraw Sales Dashboard solution is a tool for both: sales manager and sales team. It provides the visualization of key performance indicators that are critical to the entire sales organization. The custom sales dashboard displays the real-time information on sales performance KPIs with the help of intuitive and easy-to-understand diagrams and charts.
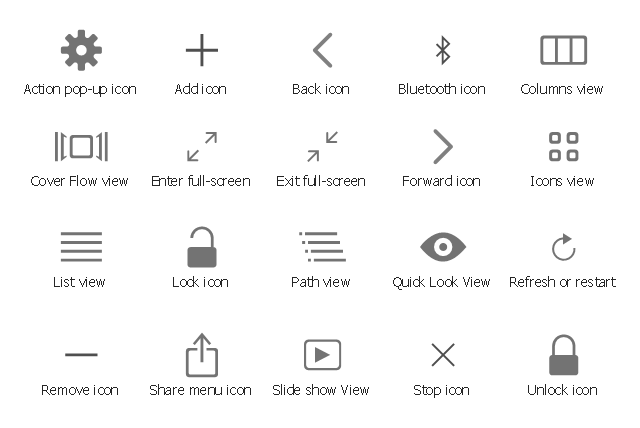
The vector stencils library "macOS Control Images" contains 20 icons for usage in toolbar controls.
Use it for user interface design of your macOS applications with ConceptDraw PRO software.
"macOS provides many template images intended for use primarily in toolbar controls. ... these images require the presence of a bounding box ..." [developer.apple.com/ library/ content/ documentation/ UserExperience/ Conceptual/ OSXHIGuidelines/ SystemProvided.html]
The toolbar control icones example "Design elements - macOS Control Images" is included in the macOS User Interface solution from the Software Development area of ConceptDraw Solution Park.
 ConceptDraw Dashboard for Facebook
ConceptDraw Dashboard for Facebook solution extends ConceptDraw PRO software with a dynamically updated visual dashboard, which shows lifetime total likes, daily friends of fans, and daily page views, information you can receive from Facebook Insights.
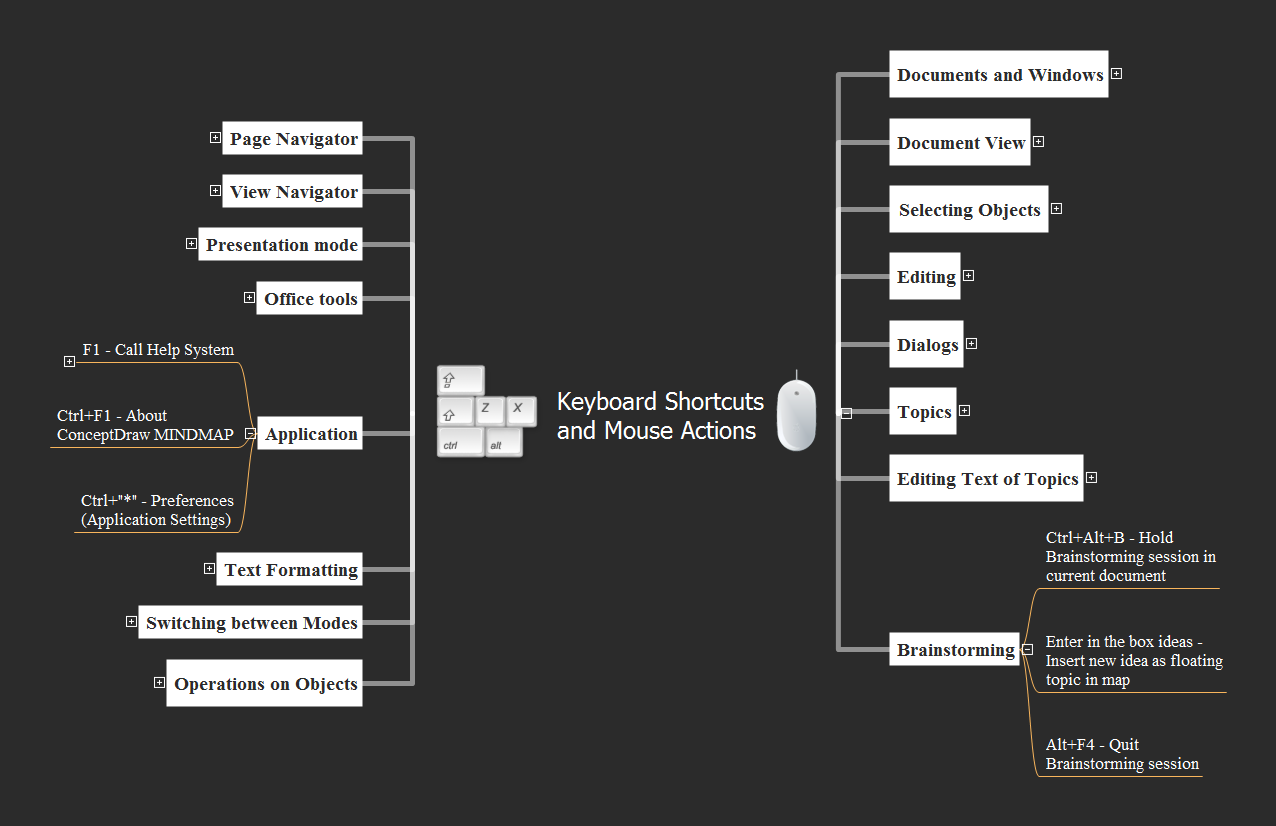
Keyboard Shortcuts and Mouse Actions
Mind Maps are an advanced technique used to solve a wide range of professional tasks, personal growth tasks, business tasks, household tasks that occur in everyday life. When you need to make a difficult decision in terms of lack of information, to prepare a report, design a presentation in original way, to organize a brainstorming session, to develop plan for the next week / month / year, to make notes during the lecture, in all these cases the mind mapping technique will be effective. The essence of the method consists in structuring the information, in visualization of objects and concepts, and also in setting the associative relationships. This method is popular in teaching and when explaining new information, and lets represent it in a concise and easily perceived form. Mind Maps can be also effectively used to represent different computer knowledge and helpful information about the use of different applications. ConceptDraw MINDMAP is powerful software for designing different Mind Maps, including the Mind Map demonstrating the keyboard shortcuts and mouse actions that are utilized in ConceptDraw MINDMAP.- Ios Refresh Icon Line Png
- Window elements - Vector stencils library | Window elements ...
- HR arrows - Vector stencils library | Offensive Play – Double Wing ...
- Computer pictograms - Vector stencils library | Computer pictograms ...
- HR arrows - Vector stencils library | Arrows - Vector clipart library ...
- Cisco Media. Cisco icons, shapes, stencils and symbols | Media ...
- Arrows - Vector clipart library | Illustration | Presentation Clipart | Up ...
- Arrows - Vector clipart library
- Arrows - Vector clipart library | Presentation Clipart | Circular Arrows ...
- Arrows - Vector clipart library | Comparison indicators - Vector ...
- Arrows - Vector clipart library | Sales arrows - Vector stencils library ...
- HR arrows - Vector stencils library | Cruve Arrow Icon Png
- Arrows - Vector clipart library | HR arrows - Vector stencils library ...
- Arrows - Vector clipart library | HR arrows - Vector stencils library ...
- Arrow Vector Image Png
- iPhone interface - Vector stencils library | Graphic User Interface | Ios ...
- Arrow Graphic Vector Png
- Media - Vector stencils library
- Basic Line Graphs | Arrows - Vector clipart library | Menus - Vector ...
- Audio Images
