HelpDesk
How to Create a Meter Dashboard
The Time Series Dashboard Solution can be used to create the interactive Time Series Charts as Column Charts, Line Charts, or Bar Charts for your interactive dashboard.This vector stencils library contains 195 cloud computing icons.
Use it to design cloud computing infographic and diagrams with ConceptDraw PRO software.
"Cloud computing, also on-demand computing, is a kind of Internet-based computing that provides shared processing resources and data to computers and other devices on demand. It is a model for enabling ubiquitous, on-demand access to a shared pool of configurable computing resources (e.g., networks, servers, storage, applications and services), which can be rapidly provisioned and released with minimal management effort. Cloud computing and storage solutions provide users and enterprises with various capabilities to store and process their data in third-party data centers.
Cloud computing has become a highly demanded service or utility due to the advantages of high computing power, cheap cost of services, high performance, scalability, accessibility as well as availability." [Cloud computing. Wikipedia]
The vector stencils library "Cloud clipart" is included in the Cloud Computing Diagrams solution from the Computer and Networks area of ConceptDraw Solution Park.
 Meter Dashboard
Meter dashboard solution extends ConceptDraw DIAGRAM software with templates, samples and vector stencils library with meter indicators for drawing visual dashboards showing quantitative data.
HelpDesk
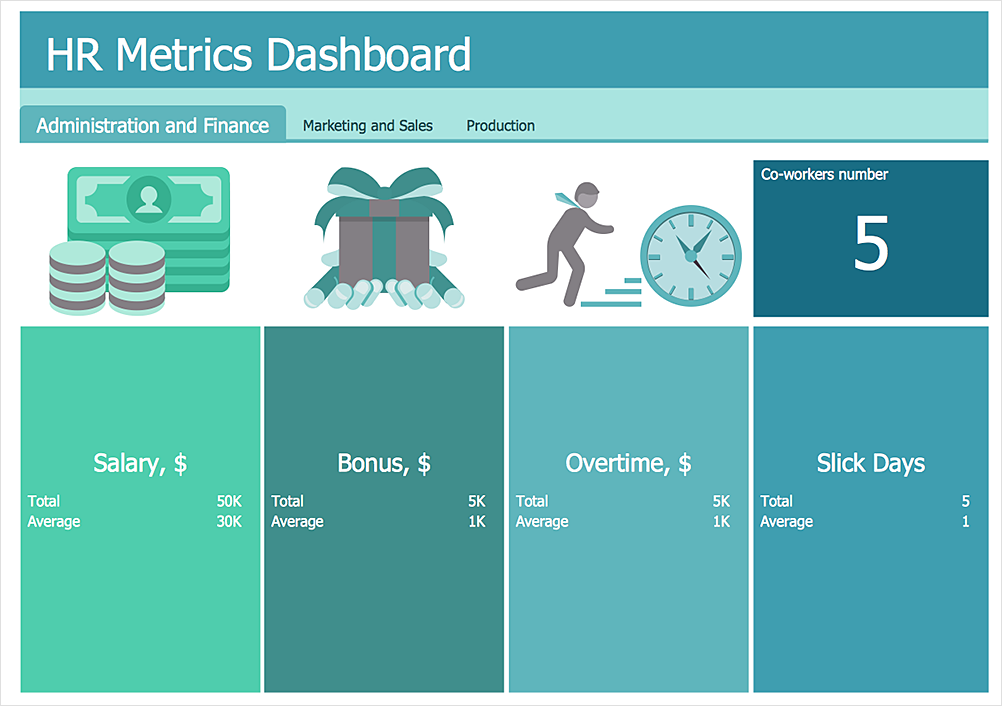
How To Create an HR Metric Dashboard
Human Resources dashboards can be used for analyzing hr workflow in an organization and identifying points for improvement. They are useful to HR managers, and for C level executives. HR dashboard helps to monitor HR KPIs. Thus Decision makers will ensure that company strategy is aligned from an executive, to managerial, to individual goals. HR Dashboard Solution for ConceptDraw DIAGRAM allows you to see what information you need from each KPI to see if your Human Resources management performs accurate and cost-efficient.Flowchart Examples
It’s very simple, convenient and quick to design professional looking Flowcharts of any complexity using the ConceptDraw DIAGRAM diagramming and vector drawing software extended with Flowcharts Solution from the "Diagrams" Area of ConceptDraw Solution Park which provides a wide set of predesigned objects, templates, samples and Flowchart examples.Cause and Effect Diagrams
Cause and Effect Diagrams are designed to identify the potential factors that cause an overall effect. The causes are grouped into the categories, each cause is a source of variation. ConceptDraw DIAGRAM powerful diagramming and vector drawing software provides the Fishbone Diagrams solution from the Management area of ConceptDraw Solution Park that allows to design the Cause and Effect Diagrams quick, easy and effective.Mechanical Design Software
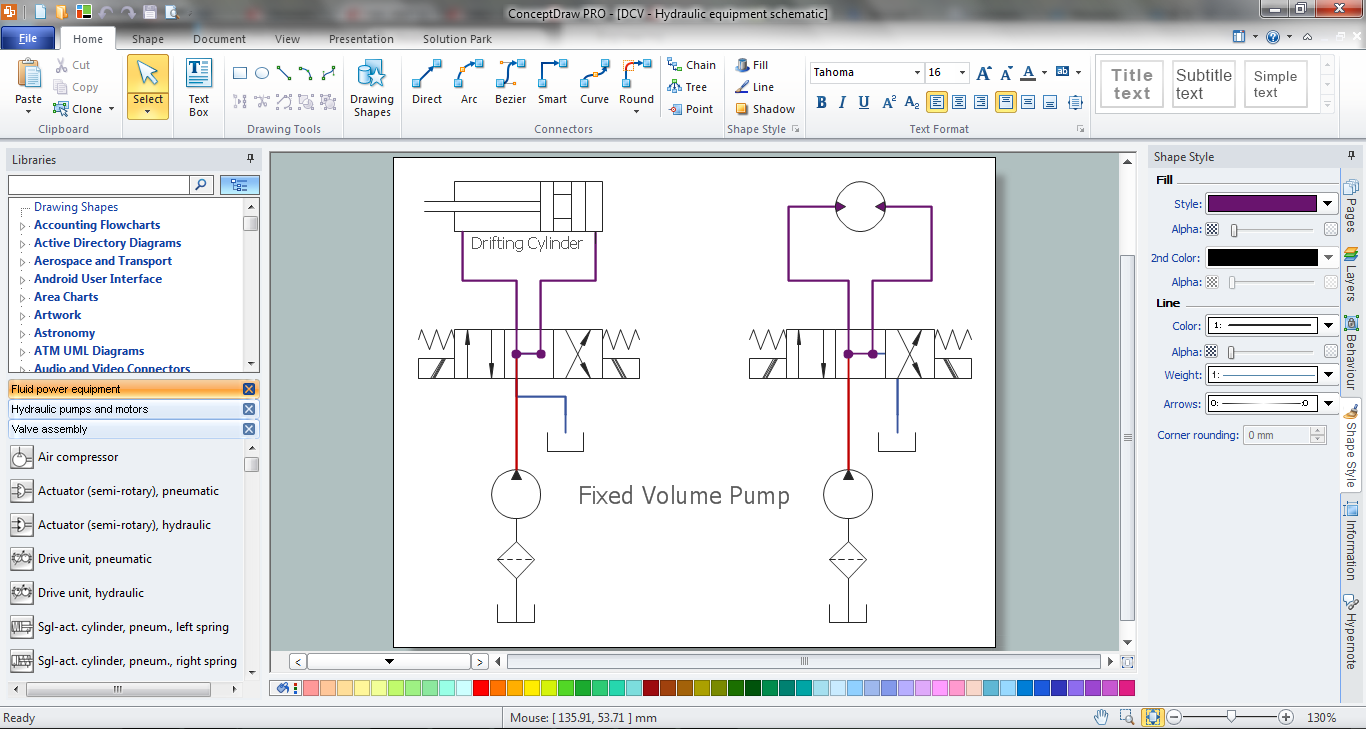
Mechanical design is a labour-intensive process. To facilitate the task of Mechanical Engineering Diagrams creating, ConceptDraw DIAGRAM diagramming and vector drawing software was extended with Mechanical Engineering solution from the Engineering area. Now, ConceptDraw DIAGRAM is a powerful Mechanical Design Software.Process Flow Diagrams
A process flow diagram (PFD) is a diagram commonly used in chemical and process engineering to indicate the general flow of plant processes and equipment. ConceptDraw DIAGRAM diagramming and vector drawing software extended with Flowcharts Solution from the "Diagrams" Area of ConceptDraw Solution Park offers the extensive drawing tools for quick and easy design professional looking Process Flow Diagrams.Half Pipe Plans
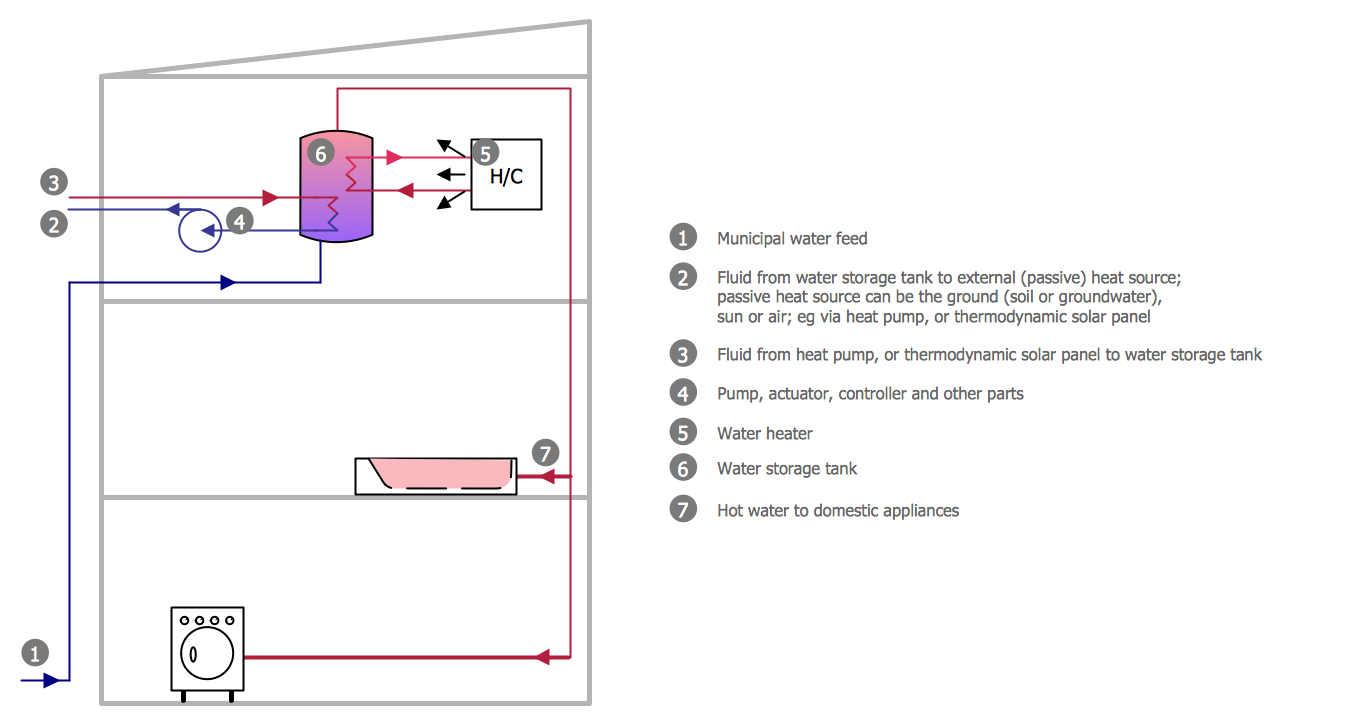
Drawing of Half Pipe Plans is quite complex process. But now it's very to design the Half Pipe Plans of any complexity with ConceptDraw DIAGRAM diagramming and vector drawing software extended with Plumbing and Piping Plans Solution.
 Mechanical Engineering
This solution extends ConceptDraw DIAGRAM.9 mechanical drawing software (or later) with samples of mechanical drawing symbols, templates and libraries of design elements, for help when drafting mechanical engineering drawings, or parts, assembly, pneumatic,
- Speedometer Powerpoint Template Free
- Instruments - Vector stencils library | Meter indicators 2 - Vector ...
- Sales KPIs and Metrics - Vector stencils library | Design elements ...
- Management indicators - Vector stencils library | Education ...
- Meter Dashboard | Design elements - Sales dashboard | How to ...
- KPIs and Metrics | Sales KPIs and Metrics - Vector stencils library | A ...
- Georgia DOT performance management - Meter dashboard ...
- Rack diagrams - Vector stencils library | Cloud round icons - Vector ...
- Free Dashboard Templates Powerpoint
- Sales Dashboard | Meter Dashboard | PM Dashboards | Dashboard


-cloud-clipart---vector-stencils-library.png--diagram-flowchart-example.png)
-cloud-clipart---vector-stencils-library.png--diagram-flowchart-example.png)


-cloud-clipart---vector-stencils-library.png--diagram-flowchart-example.png)


-cloud-clipart---vector-stencils-library.png--diagram-flowchart-example.png)
-cloud-clipart---vector-stencils-library.png--diagram-flowchart-example.png)


