 Health Food
The Health Food solution contains the set of professionally designed samples and large collection of vector graphic libraries of healthy foods symbols of fruits, vegetables, herbs, nuts, beans, seafood, meat, dairy foods, drinks, which give powerful possi
Pictures of Vegetables
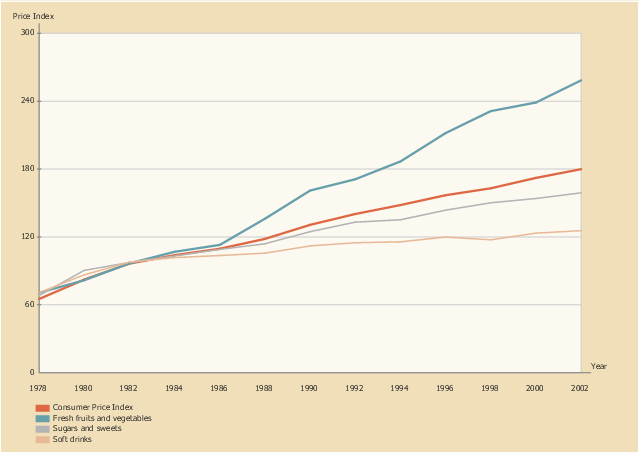
Designing of food images, fruit art illustrations, pictures of vegetables, and many other food and cafe related images and infographics has never been easier than it is now with ConceptDraw DIAGRAM software. ConceptDraw DIAGRAM diagramming and vector drawing software extended with Food Court solution from the Food and Beverage area of ConceptDraw Solution Park is perfect food pictures design software.This line graph sample shows the relative price changes for fresh fruits and vegetables, sugars and sweets, and soft drinks, using the period 1982–84 as the baseline (index = 100), 1978–2002. It was designed on the base of line chart from the website of the U.S. National Center for Chronic Disease Prevention and Health Promotion.
"The number of overweight and obese youth has increased in recent decades, yet few data assess how the lives of children have changed during the “obesity epidemic.” ...
Eating as a primary activity declined, suggesting a shift toward snacking or eating as a secondary activity. Statistically significant trends exist for carbohydrate intake, especially for chips/ crackers/ popcorn/ pretzels (intake tripled from the mid-1970s to the mid-1990s) and soft drinks (intake doubled during the same period). Price and income data suggest possible economic reasons for these changes. The percentage of disposable income spent on food has declined continuously, and almost all of the decline has been represented by food consumed at home, yet today’s disposable income buys more calories than it has in the past. Relative prices have encouraged shifts across food types. From a baseline of 100 during 1982–84, the price index for fresh fruit and vegetables increased to 258 by 2002 (far exceeding general inflation), whereas the price index for soft drinks increased only to 126 by 2002 (below general inflation)." [cdc.gov/ pcd/ issues/ 2005/ apr/ 04_ 0039.htm]
The line chart example "Relative price changes for fresh fruits and vegetables, sugars, sweets, soft drinks" was created using the ConceptDraw PRO diagramming and vector drawing software extended with the Line Graphs solution from the Graphs and Charts area of ConceptDraw Solution Park.
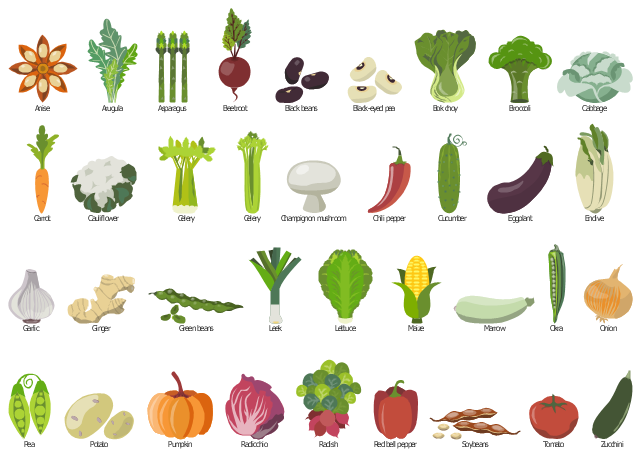
The vector stencils library "Vegetables" contains 36 vegetable icons: edible plant parts as fruits, tubers, leaves, stems, roots, beans.
Use vegetables clipart to design your food, culinary, cuisine and nutrition illustrations, infographics and presentations.
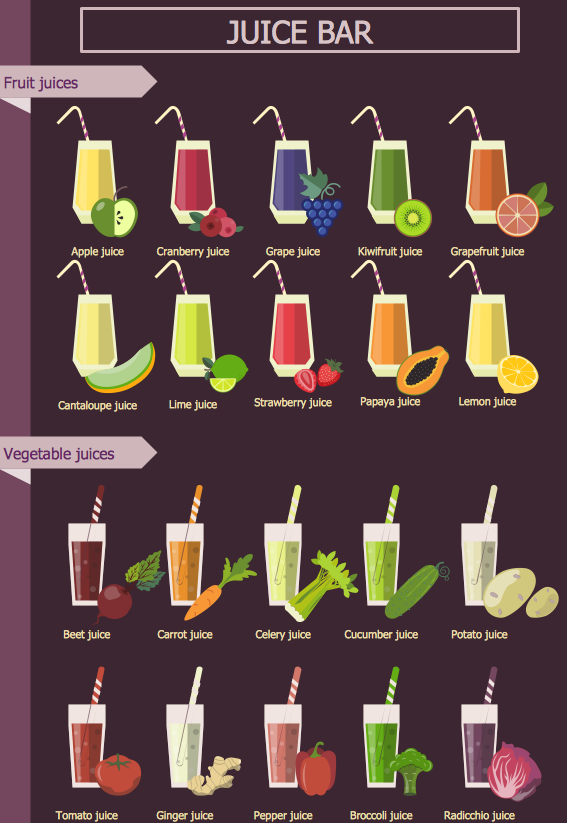
Vegetables icon set also useful for drawing fresh juices, salads, garnishes and vegetarian dishes.
"In everyday usage, a vegetable is any part of a plant that is consumed by humans as food as part of a savoury course or meal. The term "vegetable" is somewhat arbitrary, and largely defined through culinary and cultural tradition. It normally excludes other main types of plant food, fruits, nuts and cereal grains but includes seeds such as pulses." [en.wikipedia.org/ wiki/ Vegetable]
The clip art example "Design elements - Vegetables" was created using the ConceptDraw PRO diagramming and vector drawing software extended with the Food Court solution from the Food and Beverages area of ConceptDraw Solution Park.
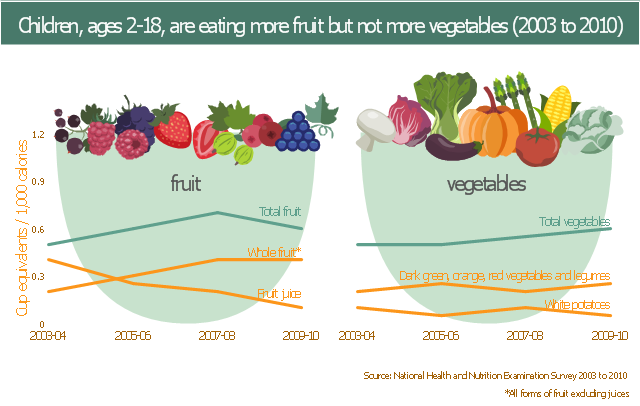
This human nutrition infogram example was redesigned from the figure from the web page "Progress on Children Eating More Fruit, Not Vegetables" from the U.S. Centers for Disease Control and Prevention (CDC) website.
[cdc.gov/ vitalsigns/ fruit-vegetables/ ]
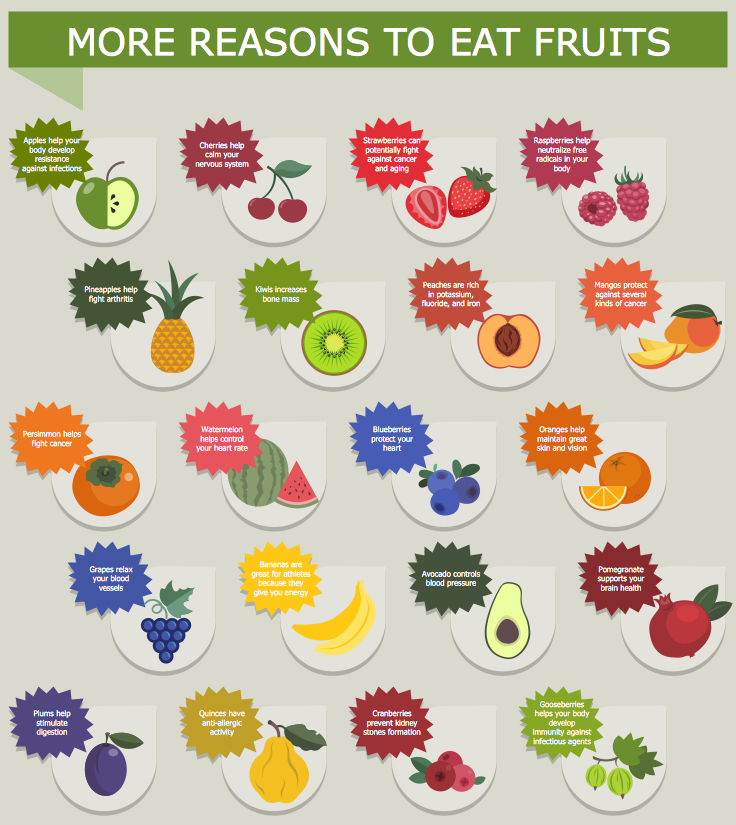
"Fruits are generally high in fiber, water, vitamin C and sugars, although this latter varies widely from traces as in lime, to 61% of the fresh weight of the date. Fruits also contain various phytochemicals that do not yet have an RDA/ RDI listing under most nutritional factsheets, and which research indicates are required for proper long-term cellular health and disease prevention. Regular consumption of fruit is associated with reduced risks of cancer, cardiovascular disease (especially coronary heart disease), stroke, Alzheimer disease, cataracts, and some of the functional declines associated with aging.
Diets that include a sufficient amount of potassium from fruits and vegetables also help reduce the chance of developing kidney stones and may help reduce the effects of bone-loss. Fruits are also low in calories which would help lower one's calorie intake as part of a weight-loss diet." [en.wikipedia.org/ wiki/ Fruit]
"Vegetables play an important role in human nutrition. Most are low in fat and calories but are bulky and filling. They supply dietary fibre and are important sources of essential vitamins, minerals and trace elements. Particularly important are the antioxidant vitamins A, C and E. When vegetables are included in the diet, there is found to be a reduction in the incidence of cancer, stroke, cardiovascular disease and other chronic ailments. Research has shown that, compared with individuals who eat less than three servings of fruits and vegetables each day, those that eat more than five servings have an approximately twenty percent lower risk of developing coronary heart disease or stroke." [en.wikipedia.org/ wiki/ Vegetable]
The example "Fruit and vegetables consumption infogram" was designed using the ConceptDraw PRO diagramming and vector drawing software extended with the Food Court solution from the Food and Beverages area of ConceptDraw Solution Park.
The vector stencils library "Picture Graphs" contains 35 templates of picture bar graphs for visual data comparison and time series.
Drag a template from the library to your document, set bars number, type category labels, select bars and enter your data.
Use these shapes to draw your pictorial bar charts in the ConceptDraw PRO diagramming and vector drawing software.
The vector stencils library "Picture Graphs" is included in the Picture Graphs solution from the Graphs and Charts area of ConceptDraw Solution Park.
