Venn Diagram
Venn diagrams are illustrations used in the branch of mathematics known as set theory. They show the mathematical or logical relationship between different groups of things (sets). A Venn diagram shows all the possible logical relations between the sets.Venn Diagram Template for Word
This template shows the Venn Diagram. It was created in ConceptDraw PRO diagramming and vector drawing software using the ready-to-use objects from the Venn Diagrams Solution from the "What is a Diagram" area of ConceptDraw Solution Park.Multi Layer Venn Diagram. Venn Diagram Example
To visualize the relationships between subsets of the universal set you can use Venn diagrams. To construct one, you should divide the plane into a number of cells using n figures. Each figure in the chart represents a single set of, and n is the number of represented sets. Splitting is done in a way that there is one and only one cell for any set of these figures, the points of which belong to all the figures from the set and do not belong to others. The plane on which the figures are represented, is the universal set U. Thus, the point which does not belong to any of the figures, belongs only to U.Venn Diagrams
Venn Diagrams are the intuitive way to work with sets which allows to visualize all possible logical relations between several sets. They are widely used in mathematics, marketing, logic, statistics, sociology, etc.ConceptDraw PRO diagramming and vector drawing software extended with Venn Diagrams solution from "What is a Diagram" area offers set of useful drawing tools for easy creating the Venn Diagrams for any quantity of sets.
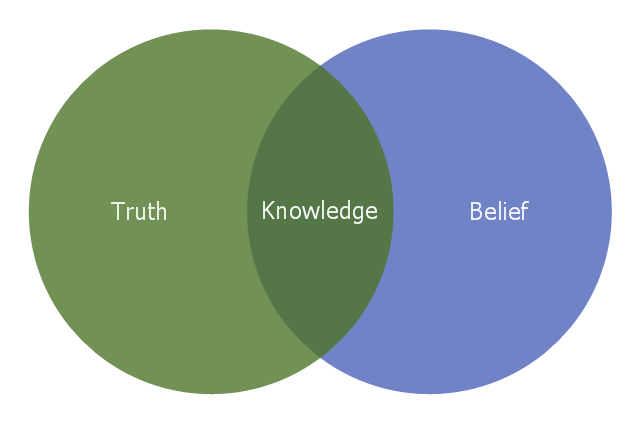
Illustration of Plato's definition of knowledge.
This Venn diagram example was redrawn from the Wikimedia Commons file: Belief Venn diagram.svg. [commons.wikimedia.org/ wiki/ File:Belief_ Venn_ diagram.svg]
"Justified true belief is a definition of knowledge that is most frequently credited to Plato and his dialogues. The concept of justified true belief states that in order to know that a given proposition is true, one must not only believe the relevant true proposition, but one must also have justification for doing so. In more formal terms, a subject S knows that a proposition P is true if and only if:
(1) P is true,
(2) S believes that P is true, and
(3) S is justified in believing that P is true" [Justified true belief. Wikipedia]
The Venn diagram example "Knowledge" was created using the ConceptDraw PRO diagramming and vector drawing software extended with the Venn Diagrams solution from the area "What is a Diagram" of ConceptDraw Solution Park.
 Venn Diagrams
Venn Diagrams are actively used to illustrate simple set relationships in set theory and probability theory, logic and statistics, mathematics and computer science, linguistics, sociology, and marketing. Venn Diagrams are also often used to visually summarize the status and future viability of a project.
3 Circle Venn. Venn Diagram Example
This example shows the 3 Circle Venn Diagram. The Venn Diagrams visualize all possible logical intersections between several sets. On this example you can see the intersections of 3 sets. Venn Diagrams are widely used in mathematics, logic, statistics, marketing, sociology, etc.2 Circle Venn Diagram. Venn Diagram Example
Using the ready-to-use predesigned objects, samples and templates from the Venn Diagrams Solution for ConceptDraw PRO you can create your own professional looking Venn Diagrams quick and easy.Mathematical Diagrams
ConceptDraw PRO diagramming and vector drawing software extended with Mathematics solution from the Science and Education area is the best for creating: mathematical diagrams, graphics, tape diagrams various mathematical illustrations of any complexity quick and easy.Mathematics solution provides 3 libraries: Plane Geometry Library, Solid Geometry Library, Trigonometric Functions Library.
New Connectors Technology
ConceptDraw PRO is a cross-platform flowcharting tool with extended HTML capabilities. It contains more than 10 000 pre-created objects and many templates, available for PC and Macintosh. Creating great designs and diagrams involves having the right drawing software.ConceptDraw new connectors called Arrows10 Technology is more than enough versatility to draw any type of diagram with any degree of complexity.
ConceptDraw is the business diagram software of choice for business professionals who need to quickly and easily visualize, explore, and communicate information.
HelpDesk
How to Create a Venn Diagram in ConceptDraw PRO
Venn diagrams were invented by John Venn as a method of depicting relationships between different components. A Venn diagram consists of two or more circles. Each circle represents a specific group or set. The entities which are depicted by circles generally have some common characteristics. A Venn Diagram shows all the possible logical relations between these entities. Any properties that belong to more than one set should be indicated in the sections where the circles overlap. A Venn Diagram can be useful to visually summarize the status and future viability of a project. ConceptDraw PRO allows you to make a Venn diagrams using the Venn Diagrams solution.Simple Diagramming
Create flowcharts, org charts, floor plans, business diagrams and more with ConceptDraw PRO.
SSADM Diagram
The vector stencils library SSADM from the solution Systems engineering contains specific symbols of SSADM diagrams for ConceptDraw PRO diagramming and vector drawing software. The Systems engineering solution is contained in Software Development area of ConceptDraw Solution Park.The example below illustrates the waterfall model used in SSADM. This model involves 5 stages of developing a product such as requirements specification and its' analysis, design, coding and testing.
- Venn Diagrams | Venn Diagram | How to Create a Venn Diagram in ...
- Venn Diagram | Venn Diagrams | Entity-Relationship Diagram (ERD ...
- Venn Diagram | Sustainable Development Illustrations
- Venn Diagram | Venn Diagrams | Knowledge - Venn diagram | Veen ...
- Venn Diagram With Illustration
- Venn Diagram Examples for Problem Solving. Computer Science ...
- Venn Diagram Examples for Problem Solving. Venn Diagram as a ...
- Venn Diagram | Venn Diagram Examples for Problem Solving ...
- Illustration Of Venn Diagram
- Cylinder Venn Diagram | Venn Diagram Examples for Problem ...
- Venn Diagram | Sociological Models With Diagrams For Illustration
- Basketball Court Dimensions | Venn Diagram Template | Venn ...
- Venn Diagram Examples | Venn Diagrams | Venn Diagram ...
- 3 Circle Venn Diagram Template
- Venn Diagram | 3 Circle Venn Diagram . Venn Diagram Example ...
- How to Create a Venn Diagram in ConceptDraw PRO | Venn ...
- Biology | Astronomy | Venn Diagram Examples for Problem Solving ...
- Chemistry | Biology | Astronomy | Example Of Solution In Science
- Venn Diagram | Venn Diagram Examples for Problem Solving. Venn ...
- Venn Diagrams | Venn Diagrams | How to Create a Venn Diagram in ...


