 Venn Diagrams
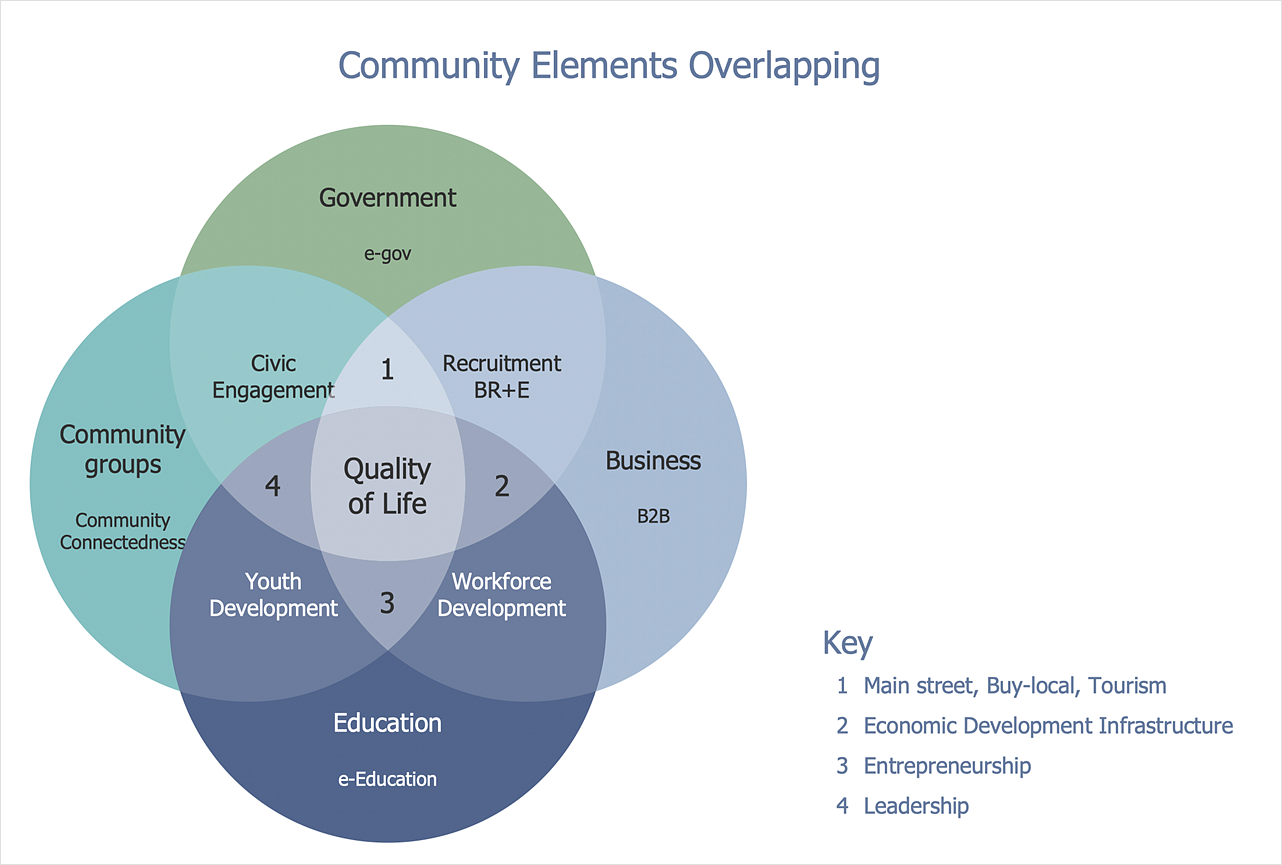
Venn Diagrams are actively used to illustrate simple set relationships in set theory and probability theory, logic and statistics, mathematics and computer science, linguistics, sociology, and marketing. Venn Diagrams are also often used to visually summarize the status and future viability of a project.
HelpDesk
How to Create a Venn Diagram
Venn diagrams were invented by John Venn as a method of depicting relationships between different components. A Venn diagram consists of two or more circles. Each circle represents a specific group or set. The entities which are depicted by circles generally have some common characteristics. A Venn Diagram shows all the possible logical relations between these entities. Any properties that belong to more than one set should be indicated in the sections where the circles overlap. A Venn Diagram can be useful to visually summarize the status and future viability of a project. ConceptDraw DIAGRAM allows you to make Venn diagrams using the Venn Diagrams solution.HelpDesk
How to Draw Physics Diagrams
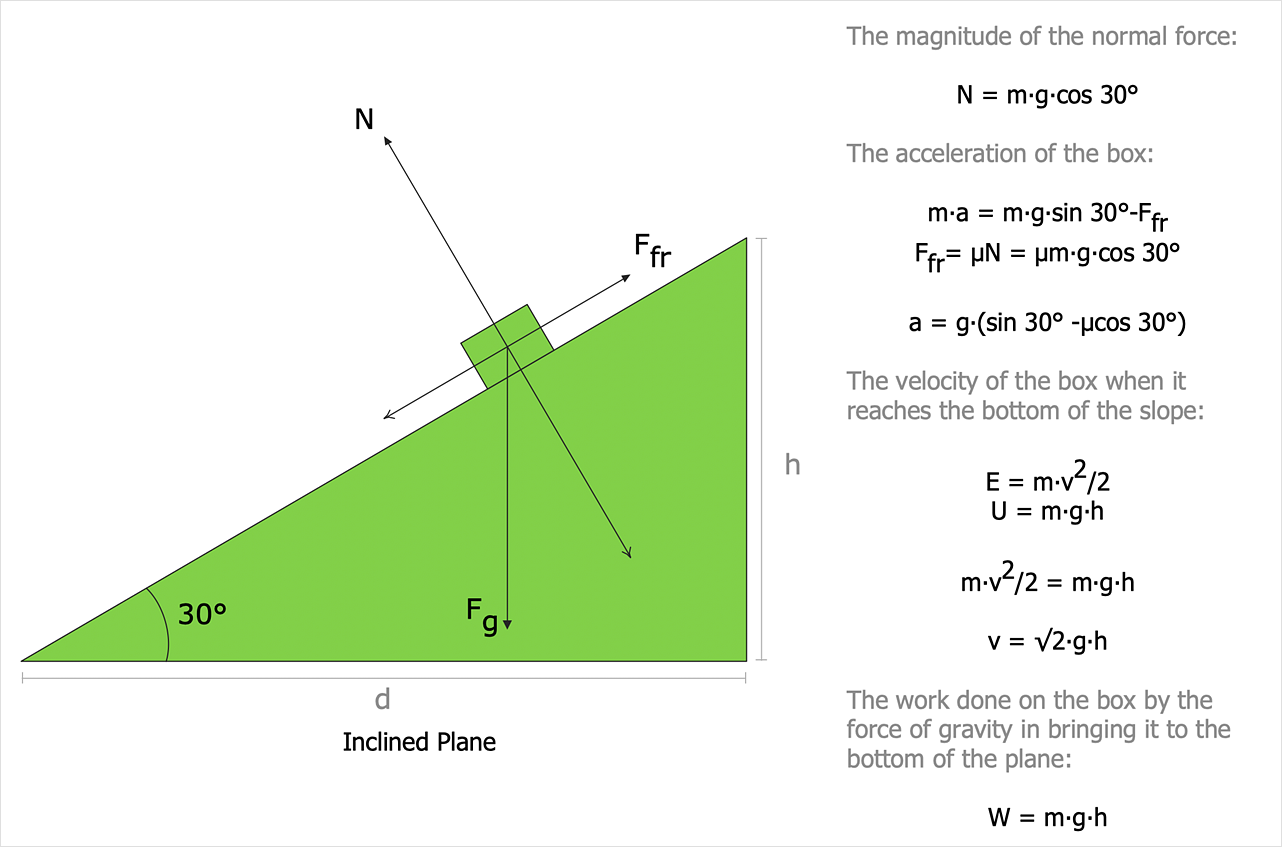
Nothing is more helpful in the study of physics as a visual representation of the physical processes: physics schemes, diagrams, and illustrations. Physics charts can be helpful when you learn Physics, perform experiments, or solve any other tasks regarding Physics. ConceptDraw DIAGRAM allows you to draw physical diagrams of mechanical, nuclear, optical and electrical processes using the set of vector physics symbols and physics diagram templates.HelpDesk
How to Make a Garden Design
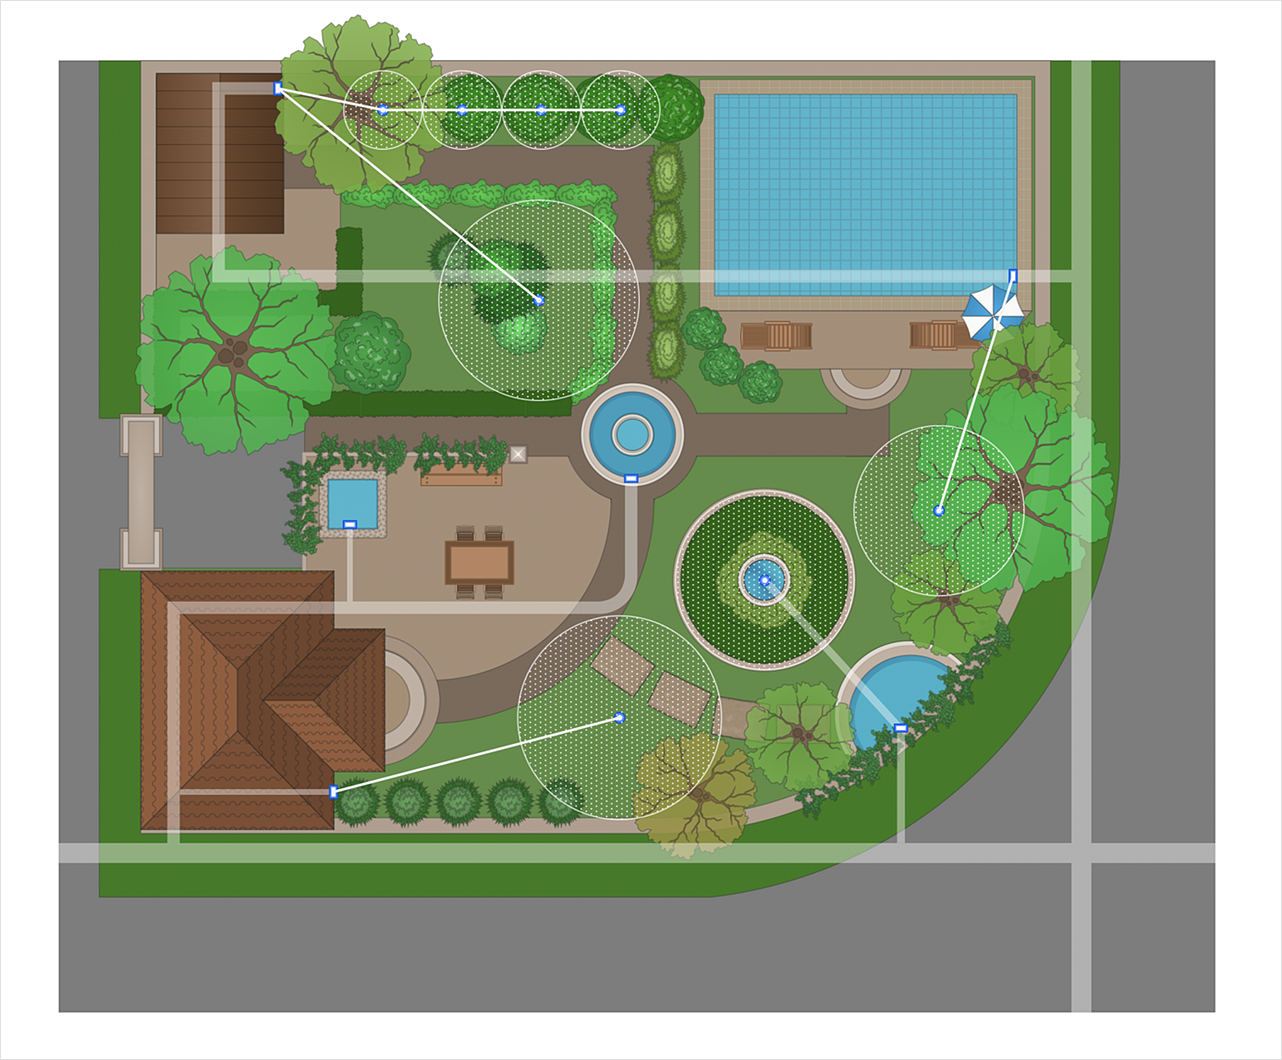
Landscape and garden design involves a varied range of activities that can be managed using ConceptDraw Landscape and Garden solution. Landscape and garden design can embrace landscape management, engineering, detailing, urbanism, assessment, and planning. The Landscape and Garden solution delivers the ability to sculpt your perfect garden design with a range of libraries and templates. These libraries include graphic design elements such as bushes and trees, flower and grass, ponds and fountains, garden furniture and accessories, and paths, plots, and patios. Using them in combination with the handy templates included with the solution is the quickest and simplest method of starting to plan your garden design.
 Computer and Networks Area
The solutions from Computer and Networks Area of ConceptDraw Solution Park collect samples, templates and vector stencils libraries for drawing computer and network diagrams, schemes and technical drawings.
Bubble diagrams in Landscape Design with ConceptDraw DIAGRAM
Bubble Diagrams are the charts with a bubble presentation of data with obligatory consideration of bubble's sizes. They are analogs of Mind Maps and find their application at many fields, and even in landscape design. At this case the bubbles are applied to illustrate the arrangement of different areas of future landscape design, such as lawns, flowerbeds, playgrounds, pools, recreation areas, etc. Bubble Diagram helps to see instantly the whole project, it is easy for design and quite informative, in most cases it reflects all needed information. Often Bubble Diagram is used as a draft for the future landscape project, on the first stage of its design, and in case of approval of chosen design concept is created advanced detailed landscape plan with specification of plants and used materials. Creation of Bubble Diagrams for landscape in ConceptDraw DIAGRAM software is an easy task thanks to the Bubble Diagrams solution from "Diagrams" area. You can use the ready scanned location plan as the base or create it easy using the special ConceptDraw libraries and templates.
 Landscape & Garden
The Landscape and Gardens solution for ConceptDraw DIAGRAM is the ideal drawing tool when creating landscape plans. Any gardener wondering how to design a garden can find the most effective way with Landscape and Gardens solution.
 ConceptDraw Solution Park
ConceptDraw Solution Park collects graphic extensions, examples and learning materials
 Basic Diagramming
This solution extends ConceptDraw DIAGRAM software with the specific tools you need to easily draw flowcharts, block diagrams, histograms, pie charts, divided bar diagrams, line graphs, circular arrows diagrams, Venn diagrams, bubble diagrams and concept maps
 Entity-Relationship Diagram (ERD)
An Entity-Relationship Diagram (ERD) is a visual presentation of entities and relationships. That type of diagrams is often used in the semi-structured or unstructured data in databases and information systems. At first glance ERD is similar to a flowch
- Venn Diagram | Design elements - Venn diagrams | Venn Diagram ...
- How To Create a Bubble Chart | Best Diagramming Software for Mac ...
- Bubble Chart Maker | How to Draw a Bubble Chart | Bubble ...
- Bubble diagrams in Landscape Design with ConceptDraw PRO ...
- Bubble diagrams in Landscape Design with ConceptDraw PRO ...
- Bubble diagrams in Landscape Design with ConceptDraw PRO ...
- Best Diagramming Software for Mac | Bubble diagrams in ...
- Bubble diagrams in Landscape Design with ConceptDraw PRO ...
- Venn Diagrams Images
- Bubble Diagrams | Bubble diagrams in Landscape Design with ...
- Multi Layer Venn Diagram . Venn Diagram Example | UML package ...
- Around The Knowledge Drawing With Conceptdraw Solution Park
- ConceptDraw Solution Park | Process Flowchart | Venn Diagrams ...
- Business Diagram Software | Software development with ...
- CAD Drawing Software for Making Mechanic Diagram and Electrical ...
- Bubble Diagram Drawing Software
- 2-Set Venn diagram - Template | Venn Diagram Examples for ...
- Best Flowchart Software | Form Maker | Entity-Relationship Diagram ...
- Best Diagramming Software for Mac
- Databases Access Objects Model with ConceptDraw PRO | UML ...


