This site uses cookies. By continuing to browse the ConceptDraw site you are agreeing to our Use of Site Cookies.

Circles Venn Diagram

This example shows the 4 Circle Venn Diagram. The Venn Diagram visualizes all possible logical relations between several sets. The sets are represented as circles on the Venn Diagram. On this example you can see the intersections of 4 sets. Venn Diagrams are widely used in mathematics, logic, statistics, marketing, sociology, etc.

Multi Layer Venn Diagram. Venn Diagram Example

To visualize the relationships between subsets of the universal set you can use Venn diagrams. To construct one, you should divide the plane into a number of cells using n figures. Each figure in the chart represents a single set of, and n is the number of represented sets. Splitting is done in a way that there is one and only one cell for any set of these figures, the points of which belong to all the figures from the set and do not belong to others. The plane on which the figures are represented, is the universal set U. Thus, the point which does not belong to any of the figures, belongs only to U.

Cylinder Venn Diagram

You need design Cylinder Venn Diagram? Nothing could be easier with ConceptDraw DIAGRAM diagramming and vector drawing software extended with Venn Diagrams Solution from the “Diagrams” Area. ConceptDraw DIAGRAM allows you to design various Venn Diagrams including Cylinder Venn Diagrams.
HelpDesk

How to Create a Venn Diagram

Venn diagrams were invented by John Venn as a method of depicting relationships between different components. A Venn diagram consists of two or more circles. Each circle represents a specific group or set. The entities which are depicted by circles generally have some common characteristics. A Venn Diagram shows all the possible logical relations between these entities. Any properties that belong to more than one set should be indicated in the sections where the circles overlap. A Venn Diagram can be useful to visually summarize the status and future viability of a project. ConceptDraw DIAGRAM allows you to make Venn diagrams using the Venn Diagrams solution.

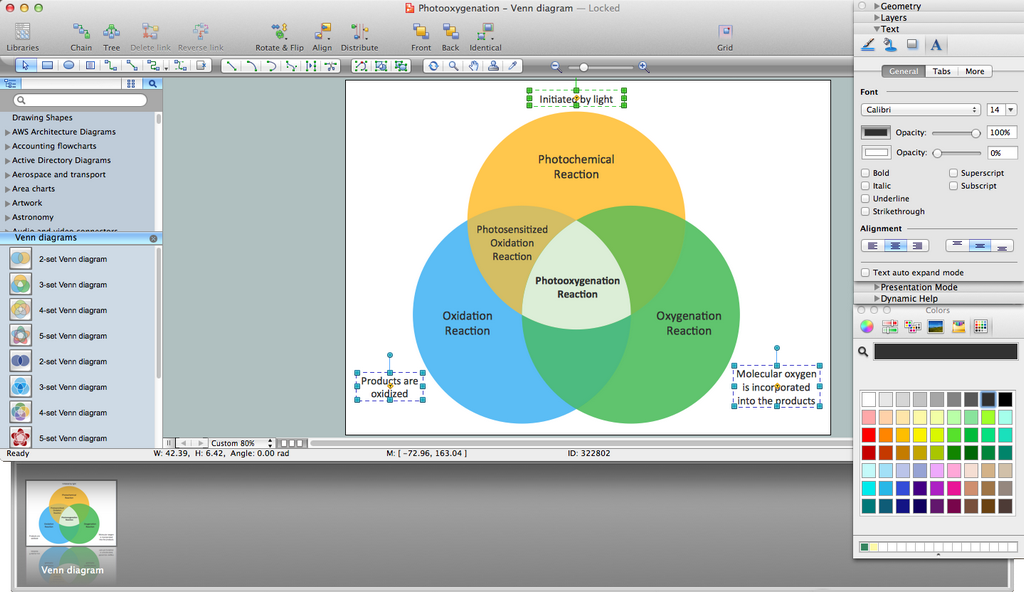
3 Circle Venn. Venn Diagram Example

This example shows the 3 Circle Venn Diagram. The Venn Diagrams visualize all possible logical intersections between several sets. On this example you can see the intersections of 3 sets. Venn Diagrams are widely used in mathematics, logic, statistics, marketing, sociology, etc.

Venn Diagram Maker

ConceptDraw DIAGRAM diagramming and vector drawing software extended with Venn Diagrams solution from the "Diagrams" area of ConceptDraw Solution Park is a powerful Venn Diagram maker. Create fast and easy your own Venn Diagrams to visualize: all the possible logical relations between sets, simple set relationships in logic, statistics, mathematics, sociology, marketing, summarize the status and future viability of a project.

Venn Diagram Template for Word

This template shows the Venn Diagram. It was created in ConceptDraw DIAGRAM diagramming and vector drawing software using the ready-to-use objects from the Venn Diagrams Solution from the "Diagrams" area of ConceptDraw Solution Park.

Venn Diagram

Venn diagrams are illustrations used in the branch of mathematics known as set theory. They show the mathematical or logical relationship between different groups of things (sets). A Venn diagram shows all the possible logical relations between the sets.

3 Circle Venn Diagram. Venn Diagram Example

This template shows the Venn Diagram. It was created in ConceptDraw DIAGRAM diagramming and vector drawing software using the ready-to-use objects from the Venn Diagrams Solution from the "Diagrams" area of ConceptDraw Solution Park.
Venn Diagrams visualize all possible logical intersections between several sets and are widely used in mathematics, logic, statistics, marketing, sociology, etc.

Venn Diagram Examples for Problem Solving. Computer Science. Chomsky Hierarchy

A Venn diagram, sometimes referred to as a set diagram, is a diagramming style used to show all the possible logical relations between a finite amount of sets. In mathematical terms, a set is a collection of distinct objects gathered together into a group, which can then itself be termed as a single object. Venn diagrams represent these objects on a page as circles or ellipses, and their placement in relation to each other describes the relationships between them.
The Venn diagram example below visualizes the the class of language inclusions described by the Chomsky hierarchy.