Process Flowchart
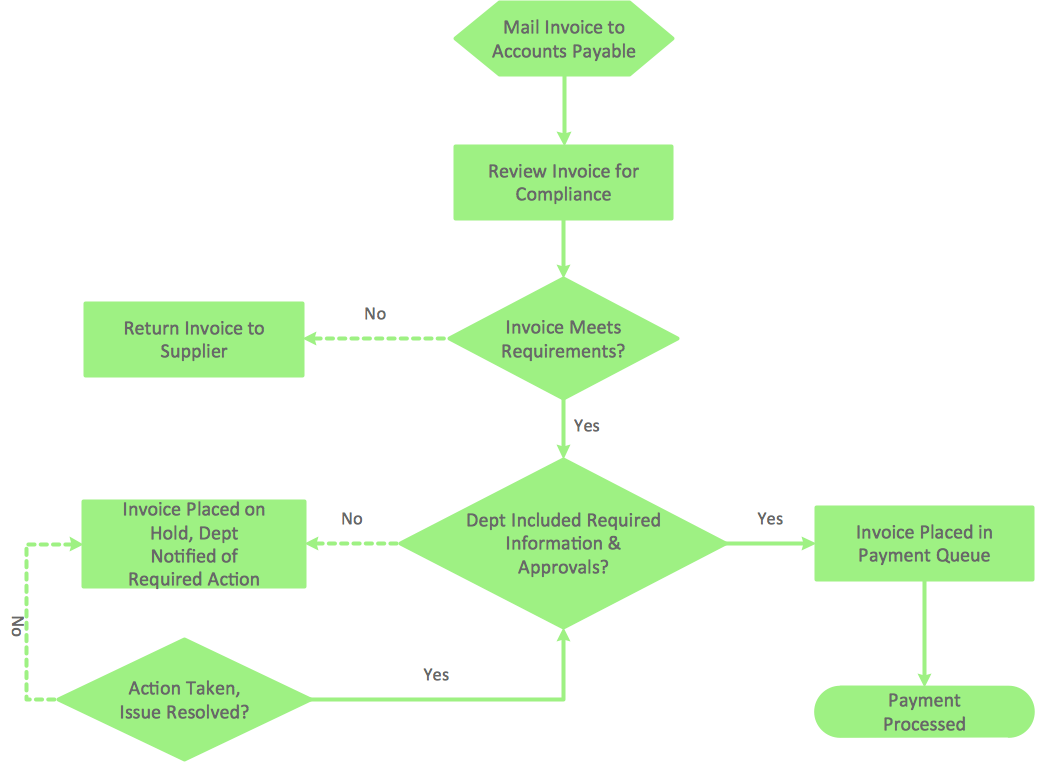
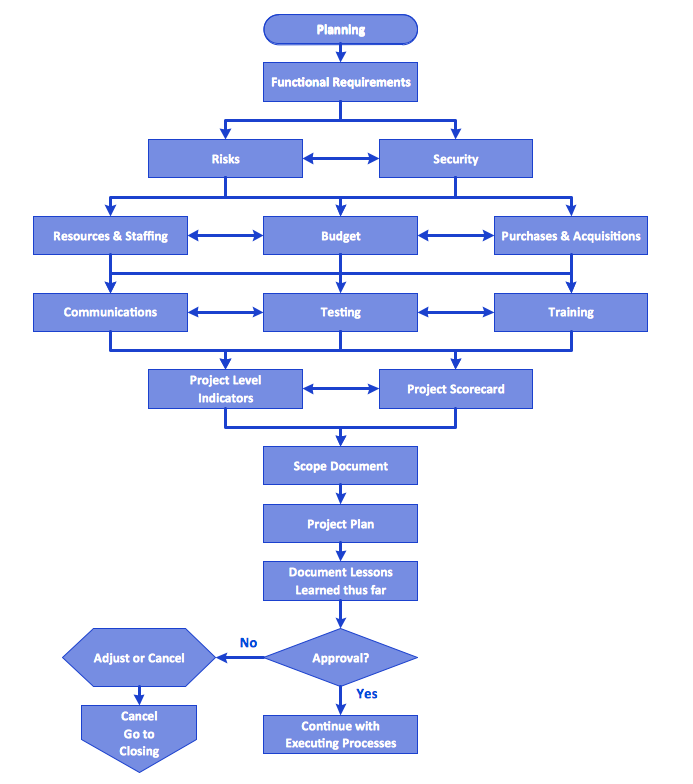
The main reason of using Process Flowchart or PFD is to show relations between major parts of the system. Process Flowcharts are used in process engineering and chemical industry where there is a requirement of depicting relationships between major components only and not include minor parts. Process Flowcharts for single unit or multiple units differ in their structure and implementation. ConceptDraw PRO is Professional business process mapping software for making Process flowcharts, Process flow diagram, Workflow diagram, flowcharts and technical illustrations for business documents and also comprehensive visio for mac application. Easier define and document basic work and data flows, financial, production and quality management processes to increase efficiency of your business with ConcepDraw PRO. Business process mapping software with Flowchart Maker ConceptDraw PRO includes extensive drawing tools, rich examples and templates, process flowchart symbols and shape libraries, smart connectors that allow you create the flowcharts of complex processes, process flow diagrams, procedures and information exchange. Process Flowchart Solution is project management workflow tools which is part ConceptDraw Project marketing project management software. Drawing charts, diagrams, and network layouts has long been the monopoly of Microsoft Visio, making Mac users to struggle when needing such visio alternative like visio for mac, it requires only to view features, make a minor edit to, or print a diagram or chart. Thankfully to MS Visio alternative like ConceptDraw PRO software, this is cross-platform charting and business process management tool, now visio alternative for making sort of visio diagram is not a problem anymore however many people still name it business process visio tools.
Cross-Functional Flowchart (Swim Lanes)
Cross-Functional Flowchart is a type of chart which shows the series of process steps connected by the arrows to depict their order and applies the swim lanes to provide an extra dimension with means of assigning each process step to certain category. Often the category or the functional unit is a stakeholder (department, person, role), resource, project, phase, or any other attribute. Cross-Functional Flowcharts visually illustrate relationships between the business processes and the functional units responsible for this processes. ConceptDraw PRO is a powerful diagramming and vector drawing software for professional design Cross-Functional Flowcharts using the common notation of shapes and swim lanes. Cross-Functional Flowcharts solution included to the Business Processes area of ConceptDraw Solution Park provides numerous well-designed vector objects and connector tools for quick, easy and effective organizing information, representing process flows and relationships, and drawing Cross-Functional Flowcharts for business, science, education, technology, etc.Cross-Functional Flowchart
Use of Cross-Functional Flowchart is a clear way of showing each team member’s responsibilities and how processes get shared or transferred between different responsible people, teams and departments. Use the best flowchart maker ConceptDraw PRO with a range of standardized cross-functional flowchart symbols to create the Cross-Functional Flowcharts simply and to visualize the relationship between a business process and the functional units responsible for that process. To draw the most quickly Cross-Functional Flowcharts, Cross Functional Process Maps, or Cross Functional Process Flow Diagrams, start with a Cross-functional flowchart samples and templates from ConceptDraw Solution Park. The ConceptDraw Arrows10 and RapidDraw technologies will be also useful for you in drawing. ConceptDraw PRO supports designing both types - horizontal and vertical Cross-functional flowcharts. A vertical layout makes the accents mainly on the functional units while a horizontal layout - on the process. If you need a Visio alternative in Mac OS X, try ConceptDraw PRO. Its interface is very intuitive and it’s actually much easier to use than Visio, yet somehow it’s just as powerful if not more so. ConceptDraw PRO performs professional quality work and seamless Visio interaction.
How to Make an Accounting Process Flowchart
Tips on how to make an accounting flowchart. Describing methods and symbols that are used to represent the accounting system.Business diagrams & Org Charts with ConceptDraw PRO
The business diagrams are in great demand, they describe the business processes, business tasks and activities which are executed to achieve specific organizational and business goals, increase productivity, reduce costs and errors. They let research and better understand the business processes. ConceptDraw PRO is a powerful professional cross-platform business graphics and business flowcharting tool which contains hundreds of built-in collections of task-specific vector stencils and templates. They will help you to visualize and structure information, create various Business flowcharts, maps and diagrams with minimal efforts, and add them to your documents and presentations to make them successful. Among them are Data flow diagrams, Organization charts, Business process workflow diagrams, Audit flowcharts, Cause and Effect diagrams, IDEF business process diagrams, Cross-functional flowcharts, PERT charts, Timeline diagrams, Calendars, Marketing diagrams, Pyramids, Target diagrams, Venn diagrams, Comparison charts, Analysis charts, Dashboards, and many more. Being a cross-platform application, ConceptDraw PRO is very secure, handy, free of bloatware and one of the best alternatives to Visio for Mac users.
Technical Flow Chart
Flow chart is a diagrammatic representation of an algorithm and essential part of planning the system. Flow charts are widely used in technical analysis and programming for easy writing programs and explaining them to others. So, one of the most popular type of flow charts is Technical Flow Chart. Technical Flow Chart can be drawn by pencil on the paper, but it will be easier to use for designing a special software. ConceptDraw PRO diagramming and vector drawing software extended with Flowcharts Solution from the "Diagrams" Area of ConceptDraw Solution Park will be useful for this goal.Flowchart Program Mac
ConceptDraw software has been developed for drawing any type of flowchart. Use RapidDraw - thi is flowchart maker technology for adding new objects to a flowchart quickly. This is technology of fast drawing technique focused on making great-looking flowcharts quickly. To get started using it download flowchart maker ConceptDraw PRO.Flowchart Marketing Process. Flowchart Examples
This sample shows the Flowchart that displays the layout and work flow of the cloud marketing platform. This diagram has a style of the marketing brochure. This style displays the central product that is related to the other issues. Using the ready-to-use predesigned objects, samples and templates from the Flowcharts Solution for ConceptDraw PRO you can create your own professional looking Flowchart Diagrams quick and easy.How to draw Metro Map style infographics? Moscow, New York, Los Angeles, London
The solution handles designs of any complexity, and the comprehensive library covers all key aspects of a transportation system. To further enhance your map design, there is the option to embed links, that can display station images or other relevant, important information. We have also included a set of samples in the solution, that show the possible real-world application — complex tube systems including the London Tube and New York City Subway show the level of detail possible when using the Metro Map Solution.Flowchart Process Example
ConceptDraw PRO is a professional software for creating great looking flowcharts. The samples included in this set of software allows users to draw any type of flowchart.- Process Flowchart | Flowchart Software | Flowchart Software Free ...
- Swim Lane Diagrams | Types of Flowcharts | Business Process ...
- Audio Visual Connectors Types | Audio and Video Connections ...
- Swim Lane Diagrams | Swim Lane Flowchart Symbols | Cross ...
- Flowchart Program Mac | Flowchart Software | Create Flow Chart on ...
- Form Builder With Custom Template
- What is Interactive Flowcharts | Flowchart Maker | Check Order ...
- Data Flow Diagram | Process Flowchart | Swim Lane Diagrams ...
- Process Flowchart | Process Engineering | Process Flow Diagram ...
- Product life cycle graph | Draw Flowcharts with ConceptDraw ...


