This site uses cookies. By continuing to browse the ConceptDraw site you are agreeing to our Use of Site Cookies.

ERD Symbols and Meanings

Entity Relationship Diagram (ERD) is a popular software engineering tool for database modeling and illustration the logical structure of databases, which uses one of two notations - Chen's or Crow’s Foot. Crow's foot notation is effective when used in software engineering, information engineering, structured systems analysis and design. Each of these notations applies its own set of ERD symbols. Crow's foot diagrams use boxes to represent entities and lines between these boxes to show relationships. Varied shapes at the ends of lines depict the cardinality of a given relationship. Chen's ERD notation is more detailed way to represent entities and relationships. ConceptDraw DIAGRAM application enhanced with all-inclusive Entity-Relationship Diagram (ERD) solution allows design professional ER diagrams with Chen's or Crow’s Foot notation on your choice. It contains the full set of ready-to-use standardized ERD symbols and meanings helpful for quickly drawing, collection of predesigned ERD samples, examples and templates. ConceptDraw Pro is a great alternative to Visio for Mac users as it offers more features and can easily handle the most demanding professional needs.
How to Build an Entity Relationship Diagram (ERD)

MS Visio Look a Like Diagrams

No need for any special drawing skills to create professional looking diagrams outside of your knowledge base. ConceptDraw DIAGRAM takes care of the technical details, allowing you to focus on your job, not the drawing. ConceptDraw DIAGRAM delivers full-functioned alternative to MS Visio. ConceptDraw DIAGRAM supports import of Visio files. ConceptDraw DIAGRAM supports flowcharting, swimlane, orgchart, project chart, mind map, decision tree, cause and effect, charts and graphs, and many other diagram types.

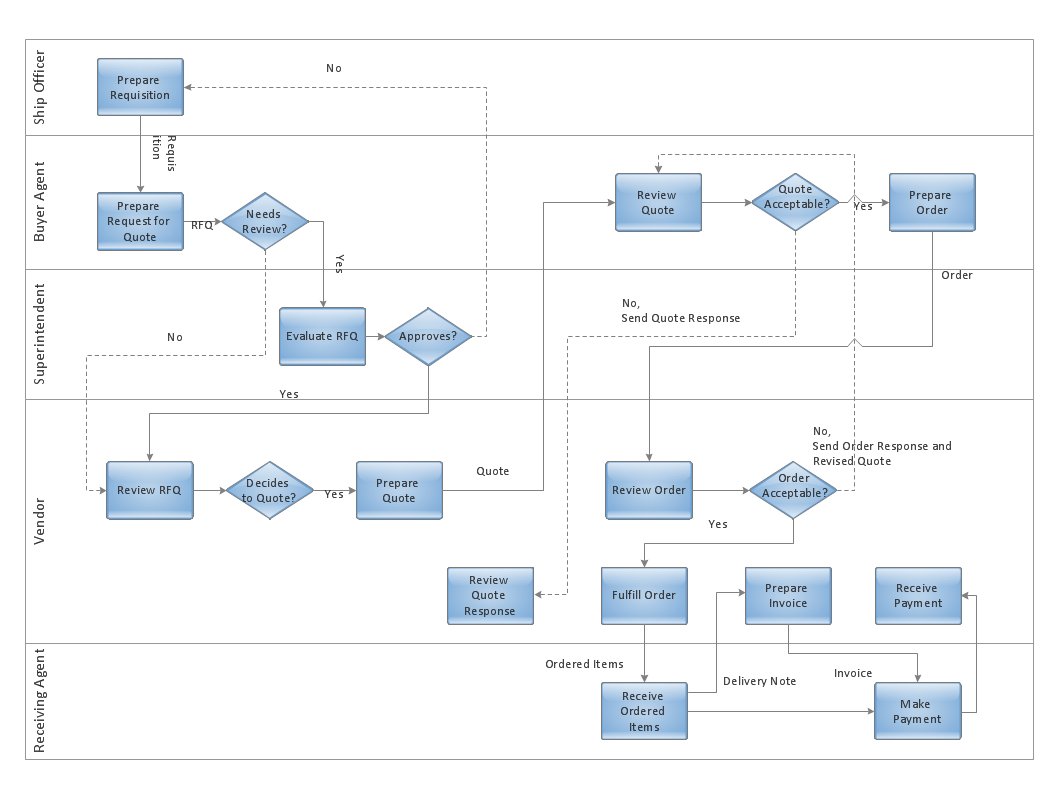
How to Simplify Flow Charting — Cross-functional Flowchart

In ConceptDraw DIAGRAM it really is sp simple to draw even the most complex cross-functional flowcharts. Use the RapidDraw technology and Cross-Functional libraries in ConceptDraw DIAGRAM for the best results.

Design Element: Crows Foot for Entity Relationship Diagram - ERD

Entity-Relationship Diagram (ERD) is ideal tool that helps execute the detalization of data warehouse for a given designed system, lets to document the system's entities, attributes (objects' properties), and their interactions each other (relationships). Creation of an ERD requires the choice of specific set of notations, which the best suits for your database design. Two notations - Chen’s and Crow's Foot are applied for ERDs design. Chen's notation was developed first and has linguistic approach, the boxes represent the entities and are considered as nouns, relationships between them are shown as diamonds in a verb form. Over time Chen’s style was adapted into the popular standard - Crow’s Foot notation, where entities are shown as boxes and relationships - as labeled lines. ConceptDraw DIAGRAM software supplied with Entity-Relationship Diagram (ERD) solution offers samples and templates of ER diagrams, and also ready-to-use vector design elements - ERD Crow′s Foot and Chen's notation icons for easy designing your own ER diagrams for depicting databases.

Developing Entity Relationship Diagrams

When you need to visually represent the structure of relational database, Entity relationship diagram (ERD) is a type of diagram for that case. Most entity-relationship diagrams can be built with objects from Flowchart solution or ERD Solution which contains inbuilt templates. Follow these steps to create your own custom ERD diagram. Don't be frightened if it looks complex, ConceptDraw DIAGRAM makes it easy to create an ERD, and hundreds of other diagrams, in minutes.

Entity-Relationship Diagram

Entity Relationship Diagram (ERD) is the world-known way to show the logical structure of databases in visual manner. The best software tool for drawing Entity-Relationship Diagram is ConceptDraw DIAGRAM ector graphics software with Entity-Relationship Diagram (ERD) solution from Software Development area which gives the ability to describe a database using the Entity-Relationship model. The vector graphic diagrams produced using this solution can be successfully used in whitepapers, presentations, datasheets, posters, or any technical materials.

timeline diagram, timeline template Timeline Diagrams

timeline diagram, timeline template
Timeline Diagrams solution extends ConceptDraw DIAGRAM diagramming software with samples, templates and libraries of specially developed smart vector design elements of timeline bars, time intervals, milestones, events, today marker, legend, and many other elements with custom properties, helpful for professional drawing clear and intuitive Timeline Diagrams. Use it to design simple Timeline Diagrams and designate only the main project stages, or highly detailed Timeline Diagrams depicting all project tasks, subtasks, milestones, deadlines, responsible persons and other description information, ideal for applying in presentations, reports, education materials, and other documentation.

Build a Flowchart Quickly With AutoConnect

ConceptDraw DIAGRAM is a professional software for building flowcharts quickly with auto-connect technology.

comparison chart, indicators Comparison Dashboard

comparison chart, indicators
Comparison dashboard solution extends ConceptDraw DIAGRAM software with samples, templates and vector stencils library with charts and indicators for drawing the visual dashboard comparing data.

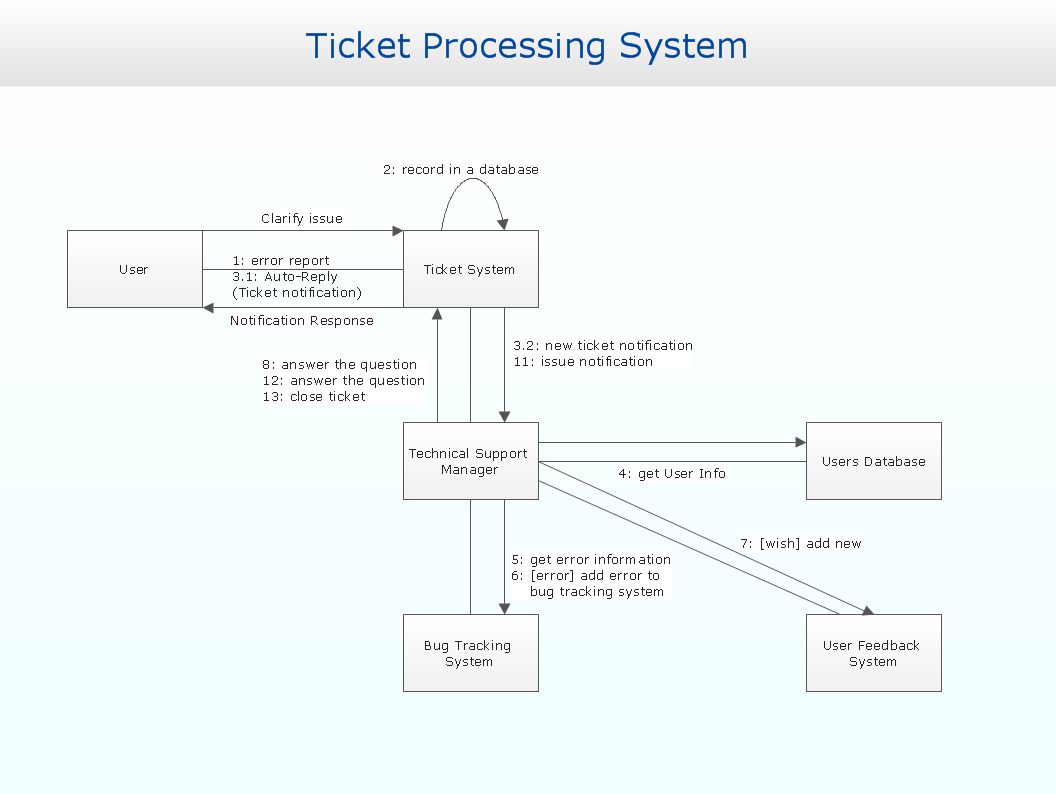
Communication Diagram UML2.0 / Collaboration UML1.x

UML Communication diagramming software with rich examples and template. ConceptDraw is ideal for software designers and software developers who need to draw UML Communication Diagrams.