Cloud Computing Architecture Diagrams
For documenting the Cloud Computing Architecture with a goal to facilitate the communication between stakeholders are successfully used the Cloud Computing Architecture diagrams. It is convenient and easy to draw various Cloud Computing Architecture diagrams in ConceptDraw DIAGRAM software with help of tools of the Cloud Computing Diagrams Solution from the Computer and Networks Area of ConceptDraw Solution Park.HelpDesk
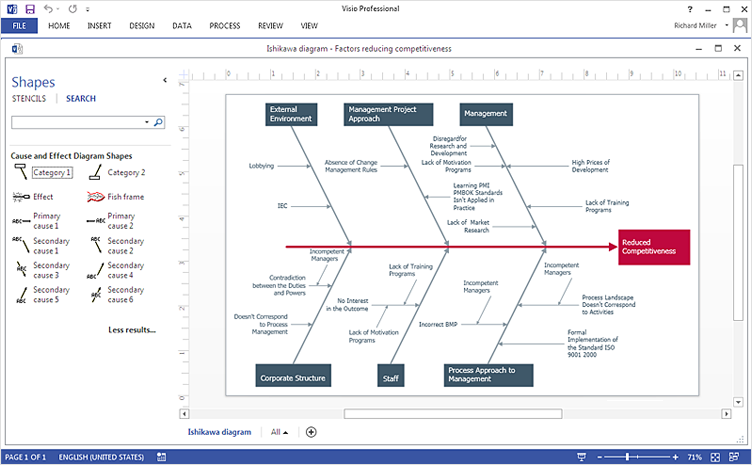
How To Create Cause and Effect (Fishbone) Diagram in MS Visio
Cause-and-Effect Ishikawa Diagram is a graphical method of analysis and cause-effect relationships, a tool in the form of fish bone. It is used to systematically determine the cause of the problem and represent it graphically. The technique is primarily used in the framework of quality management for the analysis of quality problems and their causes. Nowadays, it has found worldwide distribution and is used in multiple problem areas. It is one of the tools of lean manufacturing, which is used in group work to find the problems and their causes. ConceptDraw DIAGRAM allows you to easily create Fishbone (Ishikawa) diagram and then make a MS Visio VSDX, or VSD files from your diagrams in a couple clicks, using the export capabilities of ConcewptDraw DIAGRAM.HelpDesk
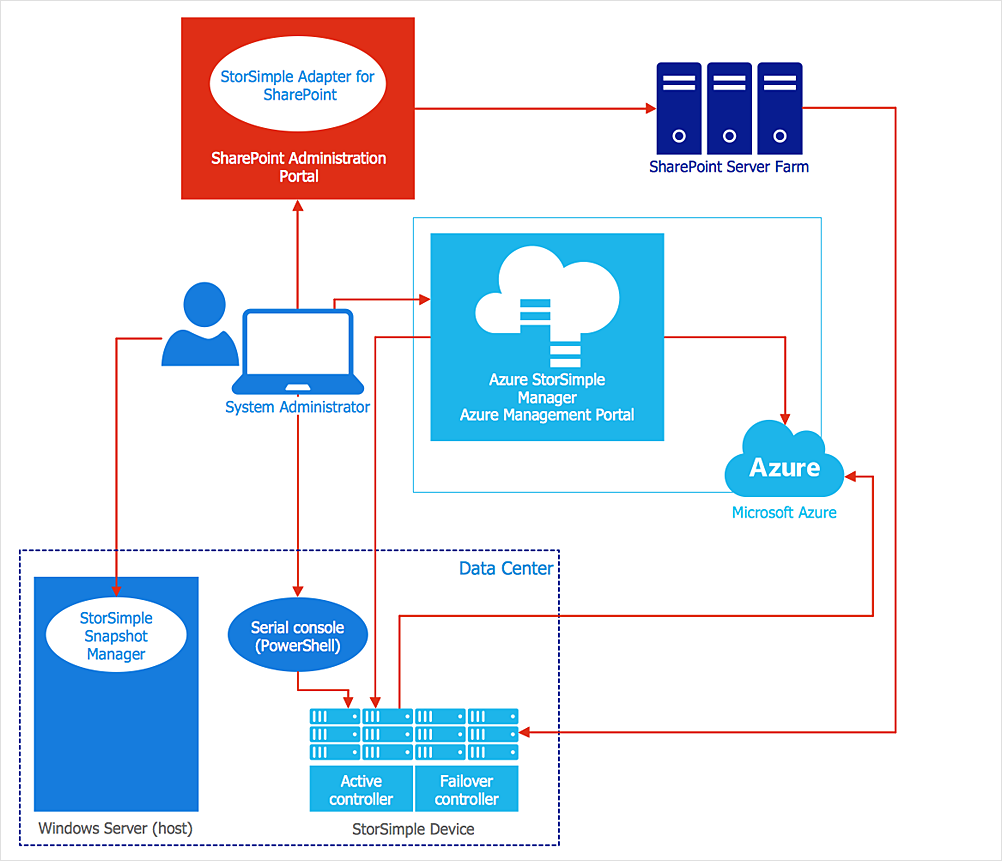
How to Create an Azure Architecture Diagram
Microsoft Azure is an open cloud computing platform, designed by Microsoft. It provides the ability to develop and launch applications and to store data on servers in distributed data centers. Microsoft Azure cloud offers two models - platform as a service (PaaS) and infrastructure as a service (IaaS). The efficiency of the Windows Azure platform is supported by a global network of Microsoft data centers. Developers use Azure Architecture diagrams to visualize and document the architecture of applications based on Microsoft Azure services. Using the ConceptDraw Azure Architecture solution makes much easier the work on documenting the Microsoft Azure architecture.HelpDesk
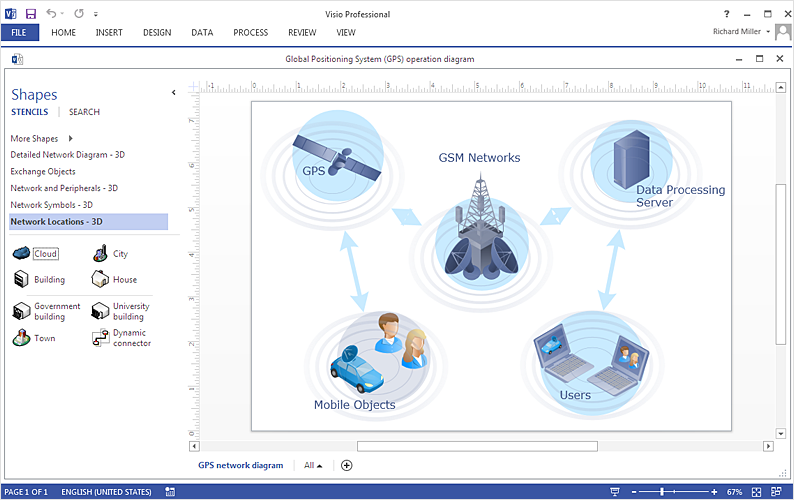
How To Create an MS Visio Telecommunication Network Diagram
Telecommunication network consists from computers and telecommunication equipment, providing information exchange between network elements. The main purpose of telecommunication networks is to provide access to distributed resources. Making a telecommunication network diagram involves many specific elements of telecommunication technology that can be managed using ConceptDraw DIAGRAM. ConceptDraw DIAGRAM allows you to easily create telecommunication network diagram of any complexity and then export it to MS Visio VSDX and VDX file. Thus you can create a pack of telecommunication network documentation, that you will easily communicate with other specialists, who use MS Visio.HelpDesk
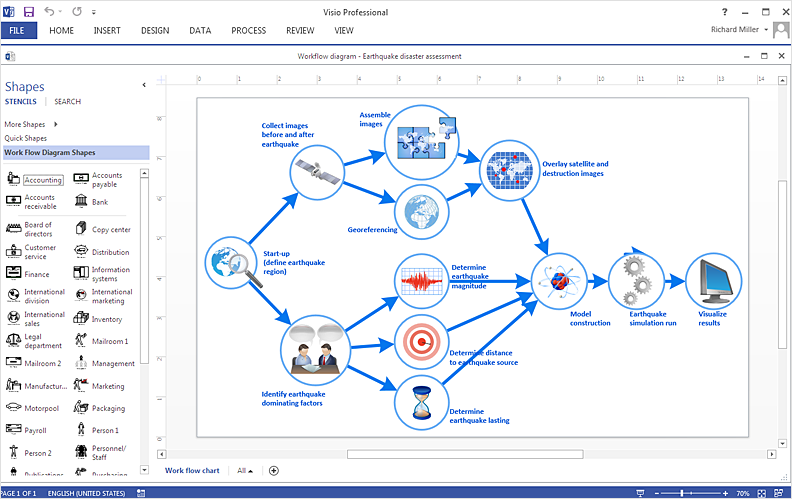
How To Create a Workflow Diagram in Visio
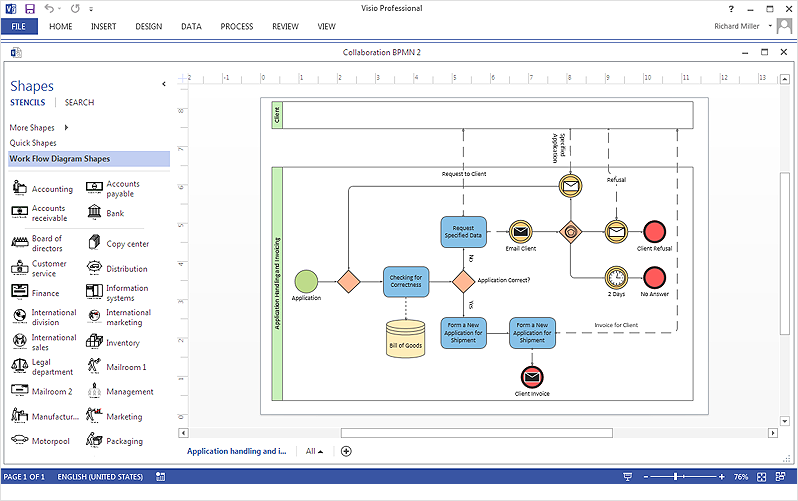
A workflow diagram shows a working process as a set of related events that follow each other in a particular order. They are usually created as flowcharts, with shapes that represent steps in the process connected by arrows that indicate the next step. Making a business process diagram involves many elements that can be managed using ConceptDraw DIAGRAM. The ability to design workflow diagrams is delivered by the Workflow Diagrams solution. ConceptDraw DIAGRAM allows you to easily create workflow diagrams and then make an MS Visio file from your diagrams. Using ConceptDraw DIAGRAM, you can export your workflow diagrams to MS Visio VSDX and VDX files.HelpDesk
How To Create a MS Visio Business Process Diagram
Business process diagrams are specialized types of flowcharts based on the Business Process Model and Notation. The BPMN specification describes the symbols to display business processes in the form of business process diagrams. The main objective of BPMN is to create a standard set of symbols that are understandable to all business users, such as business analysts who create and improve processes, technical developers responsible for implementing processes and managers who take care processes and control them. Making a business process diagram involves many different elements that can be managed using ConceptDraw DIAGRAM. The ability to design Business process diagrams is delivered by the Business Process Diagrams solution. ConceptDraw DIAGRAM supports export of business process diagrams to MS Visio files. Thus, you can share your business documentation with MS Visio users.HelpDesk
How To Make an MS Visio Rack Diagram
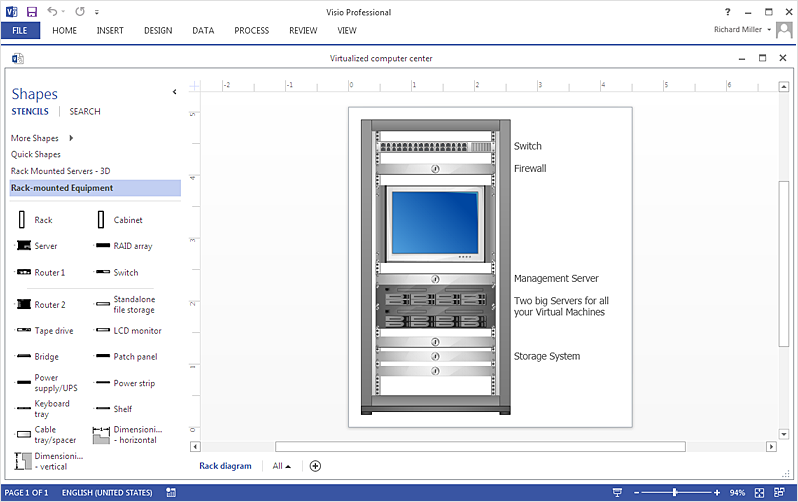
Rack Diagram is a tool of network engineers and administrators. It should depict the structure of equipment installation, and provide the base to support electronic equipment, power, cooling, and cable management. ConceptDraw DIAGRAM allows you to easily create a diagram that will help to detail the type of rack equipment that best fits your needs and then lets you customize your installation. Choosing the right equipment will deliver better results as well as saving you time and money. ConceptDraw DIAGRAM allows you to create rack diagrams and then make an MS Visio file from diagrams in a few short steps.HelpDesk
How To Create an MS Visio Block Diagram
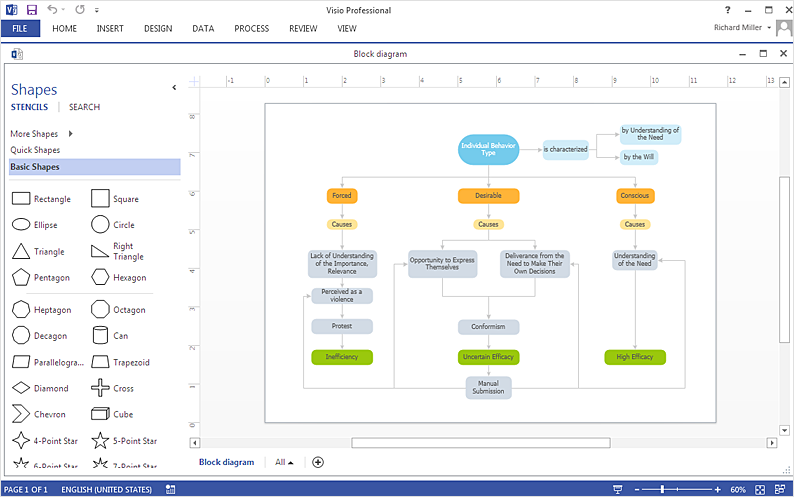
ConceptDraw DIAGRAM allows you to easily create block diagrams of any complexity and then make an MS Visio file from your diagram in a single click.HelpDesk
How To Make MS Visio Wireless Network Diagram
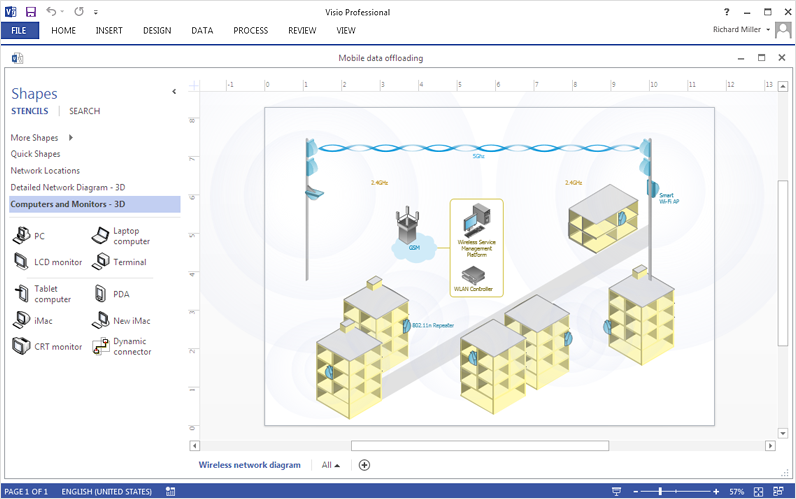
ConceptDraw DIAGRAM allows you to easily create wireless network diagrams and then make an MS Visio file from your network diagram in a single click.HelpDesk
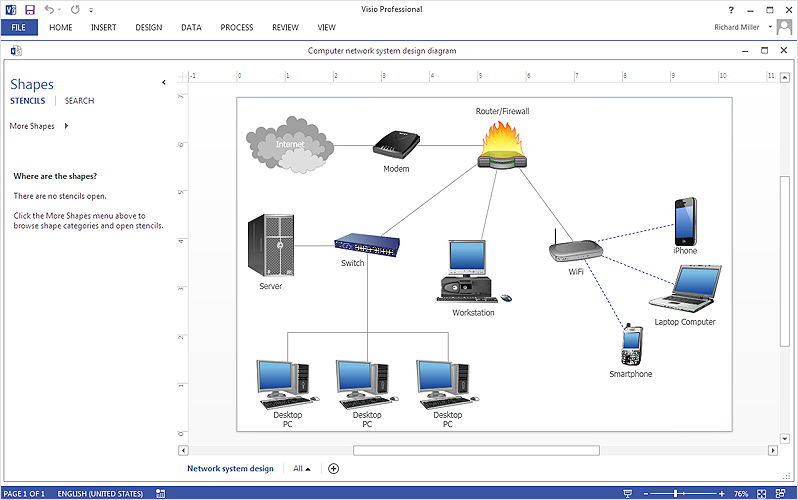
How To Create Visio Network Diagram
IT professionals are accustomed to using MS Visio for their network diagrams. Nevertheless, ConceptDraw DIAGRAM also powers, and in some cases and more feature-rich product. Given the fact that many professional people committed to MS Visio, ConceptDraw DIAGRAM developers provided users with the opportunity to share their diagrams with MS Visio users. You can use the export to VSDX and VSD format. By exporting your network diagram to MS Visio, you can easily solve the issues in communication with the users of this widespread software product.HelpDesk
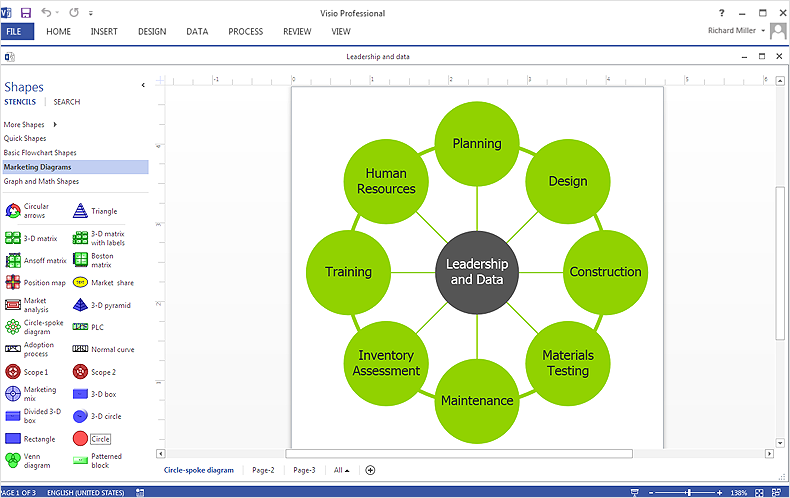
How To Make Visio Circle-Spoke Diagram
Circle-Spoke Diagram consists of a central round balloon, which is circled with other balloons as a ring. The Circle-Spoke Diagram is usually used in marketing. It shows the relationships between entities and the central element. Circle-Spoke Diagram can be used in marketing documentation and presentations. ConceptDraw DIAGRAM allows you to easily create marketing charts of any complexity, including the circle-spoke diagram and then make an MS Visio file from your diagram in a few simple steps. You can easily design your business documentation and share it easily with MS Visio users.HelpDesk
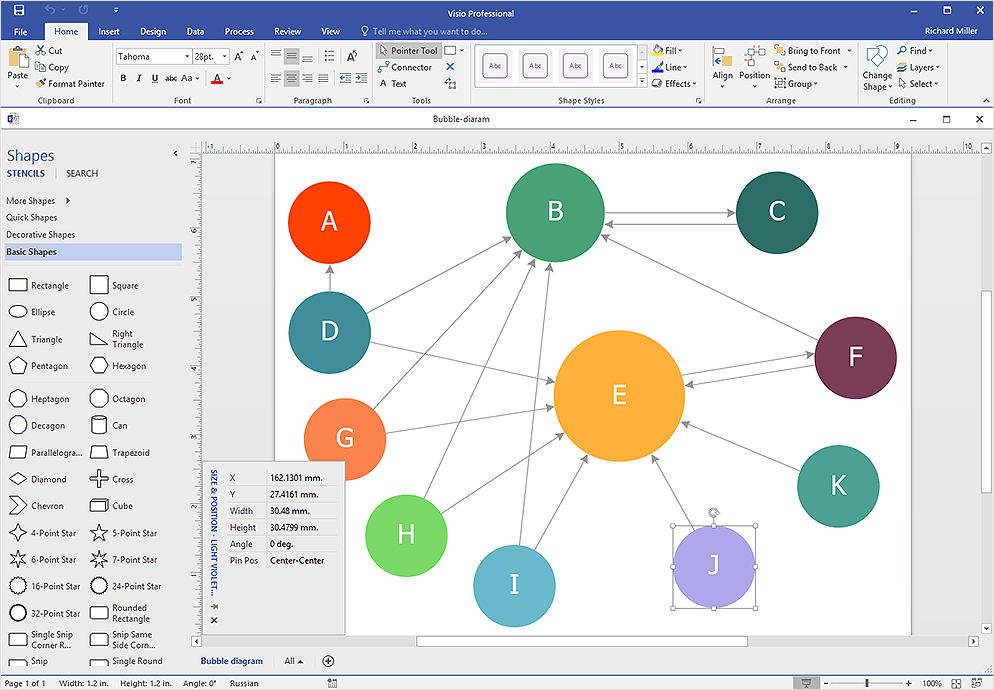
How To Create Visio Bubble Chart
ConceptDraw DIAGRAM allows you to easily create business charts and diagrams of any complexity, including the bubbles diagram and then make a MS Visio file from your diagram in a few simple steps.Amazon Web Services Diagrams diagramming tool for architecture
Amazon Web Services (AWS) offers the reliable and relatively inexpensive cloud computing services. This is the main reason why many large companies prefer to use the Amazon Cloud to storage and operate the data. ConceptDraw DIAGRAM diagramming software enhanced with AWS Architecture Diagrams solution provides the powerful AWS diagramming tools to draw the Amazon architecture diagrams and Amazon Web Services planning diagrams, to develop the Architect infrastructure based on AWS in a few minutes. The AWS Architecture Diagrams solution offers variety of built-in samples and templates for several Amazon Web Services products and resources, a wide range of predesigned and recognizable vector graphic icons used for simple designing the Architecture diagrams. The diagrams created in ConceptDraw DIAGRAM are professional-looking, helpful when designing and implementing the AWS infrastructure based systems, useful to communicate design, deployment and topology, and apposite for using in presentations, whitepapers, datasheets, posters, and other technical materials you like.
 Cloud Computing Diagrams
The Cloud Computing Diagrams solution extends the functionality of the ConceptDraw DIAGRAM diagramming software with a comprehensive collection of libraries of commonly accepted cloud computing vector stencils to help you to get started designing Cloud Computing Diagrams, Architecture Diagrams and Cloud Computing Architecture Diagrams without effort. This solution lets one professionally depict the way how the cloud computing works, allows giving a powerful introduction to the Cloud computing architecture and Amazon cloud computing architecture, to display the essence of the cloud computing, the main characteristics and classification of the cloud services thanks to the wide variety of predesigned samples and examples.
- Cloud Computing Architecture Diagrams | How To Create a MS ...
- Visio Application Services Flow Chart
- How To Create a MS Visio Computer Network Diagram Using ...
- Visio Files and ConceptDraw | UML Diagram Visio | MS Visio Look a ...
- Visio Network Diagram Storage
- Landscape Plan | Amazon Web Services Diagrams diagramming ...
- How To Create a MS Visio Computer Network Diagram Using ...
- How To Create a MS Visio Wireless Network Diagram Using ...
- AWS Architecture Diagrams | Azure Storage | Amazon Web Services ...
- Cloud Computing Architecture Diagrams | Amazon Web Services ...
- AWS Architecture Diagrams | Amazon Web Services Diagrams ...
- Telecommunication Network Diagrams | Wireless Network WAN ...
- Amazon Web Services Diagrams diagramming tool for architecture ...
- How To Create a MS Visio Telecommunication Network Diagram ...
- Ivr Flow Chart Visio
- Cloud Computing | In searching of alternative to MS Visio for MAC ...
- MS Visio Look a Like Diagrams | Network Topologies | Entity ...
- Network Service Flow Chart Visio
- How To Create a MS Visio Rack Diagram Using ConceptDraw PRO ...
- Cloud Computing Architecture Diagrams | Windows Azure | How to ...

