Best Tool for Infographic Construction
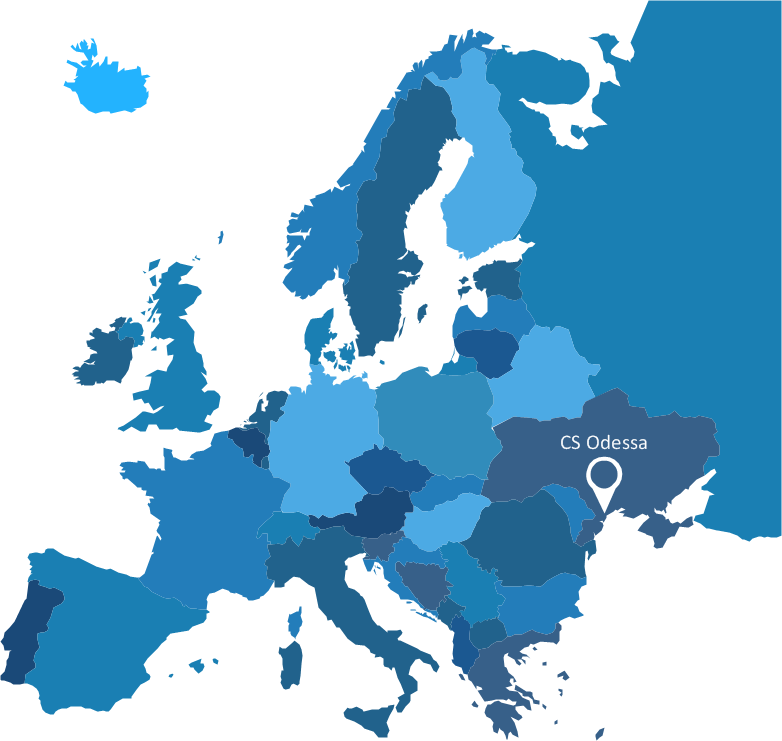
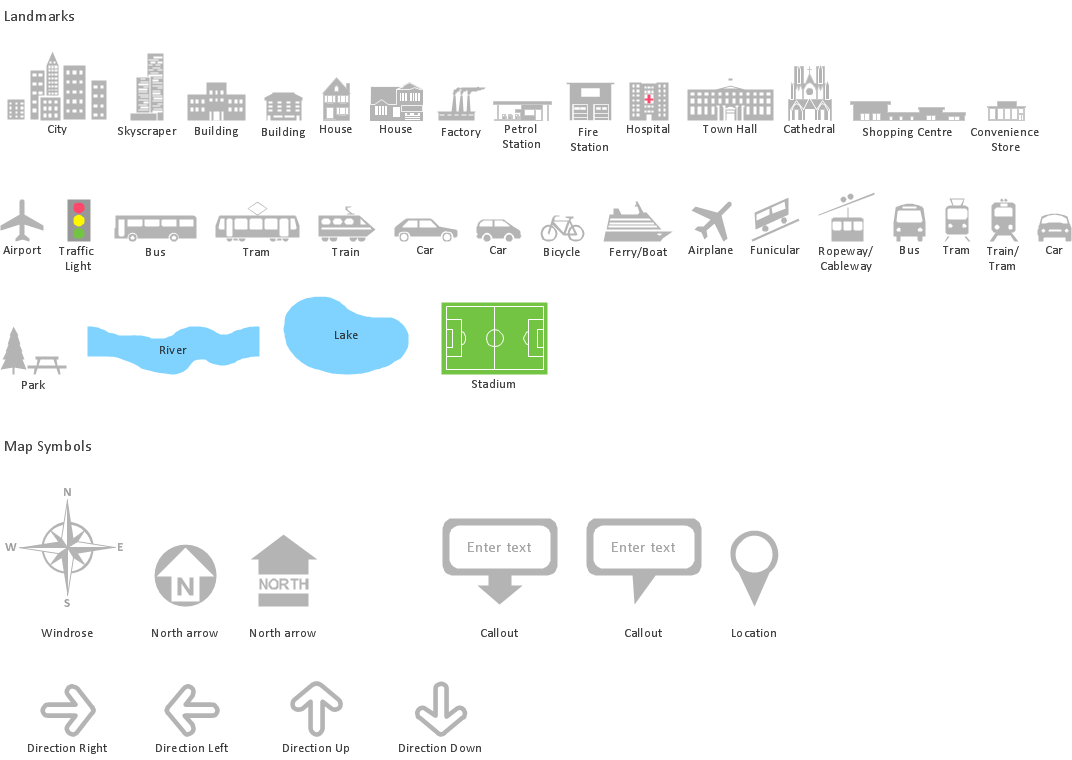
ConceptDraw is a best data visualization tool that will allow everyone to create rich infographics and visualizations quickly and easily.Spatial infographics Design Elements: Location Map
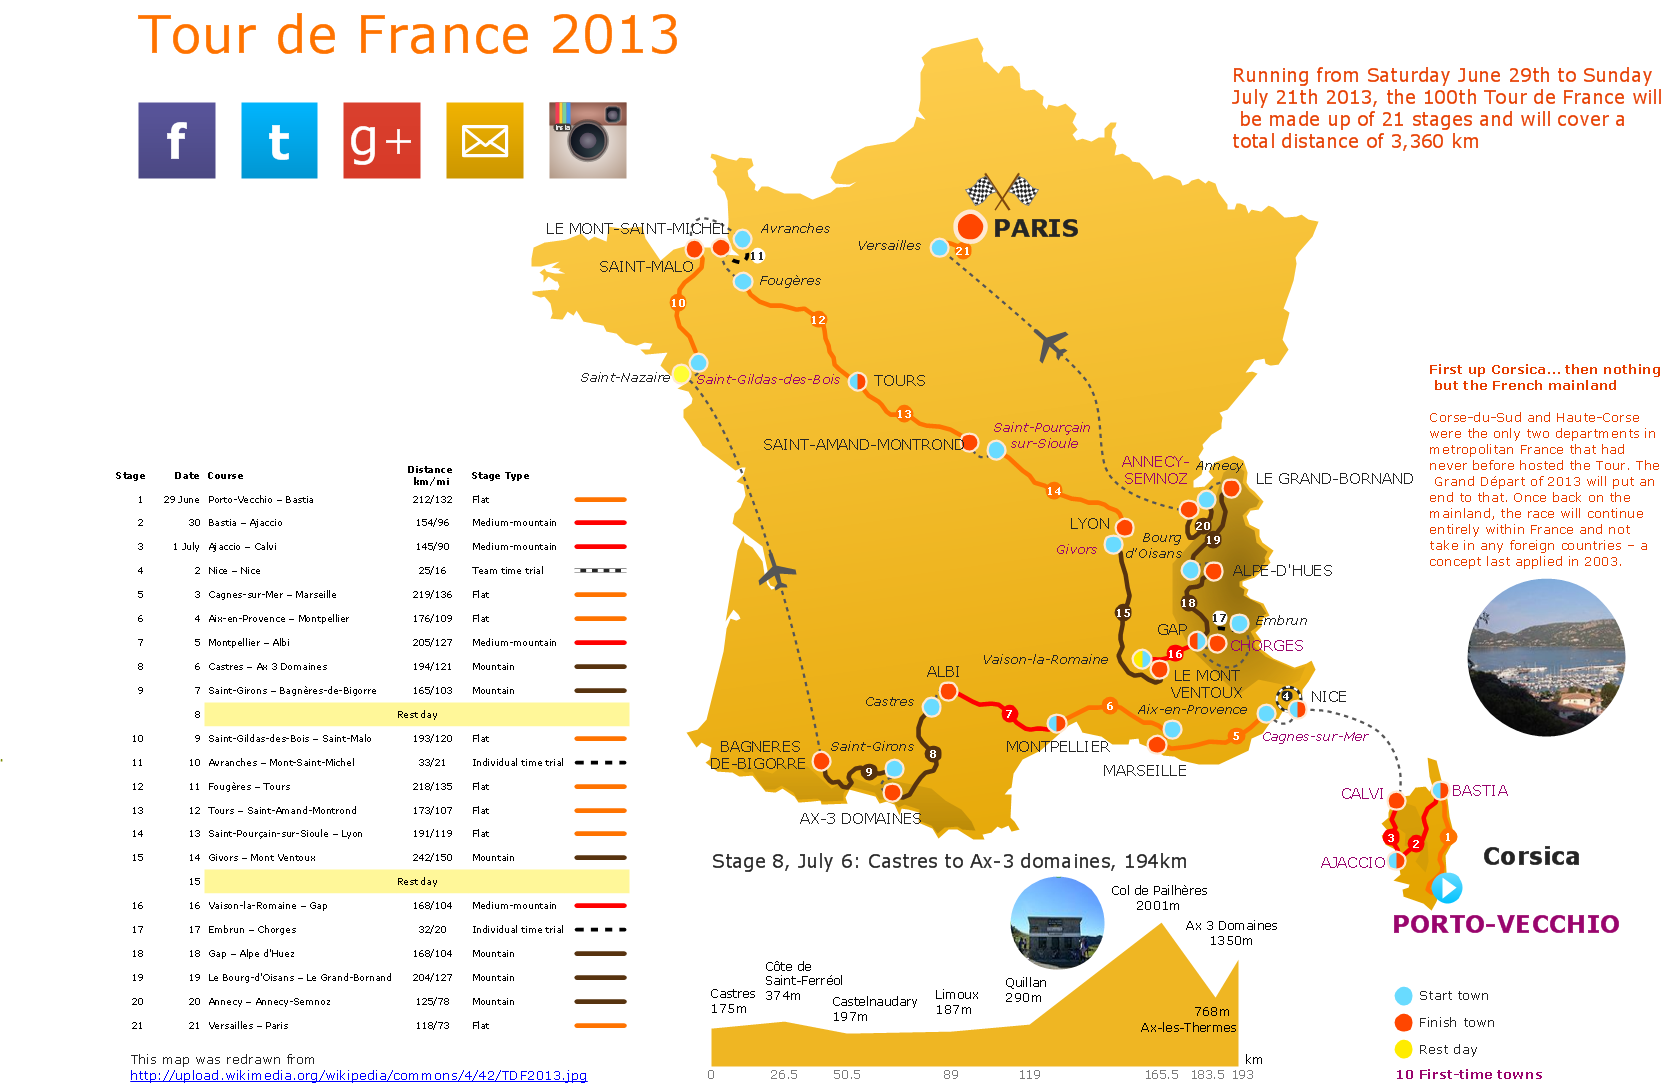
Infographic Design Elements for visually present various geographically distributed information.Excellent Examples of Infographic Maps
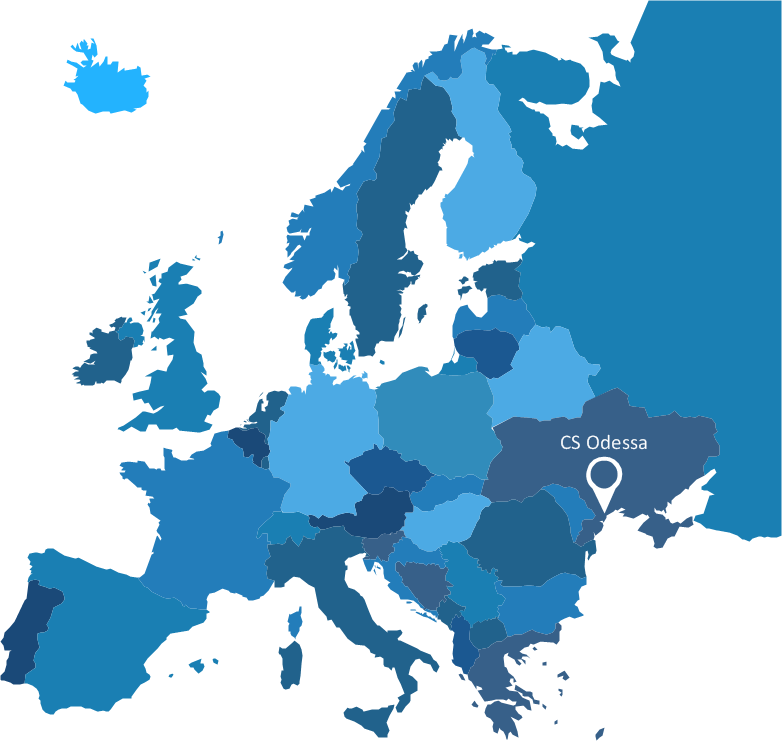
Create Spatial infographics with ConceptDraw using its excellent examples of infographic maps. We hope these can inspire and teach you!Spatial infographics Design Elements: Continental Map
ConceptDraw DIAGRAM is a software for making infographics illustrations. You can work with various components to build really impressive and easy-to-understand infographics design.Superb Examples of Infographic Maps
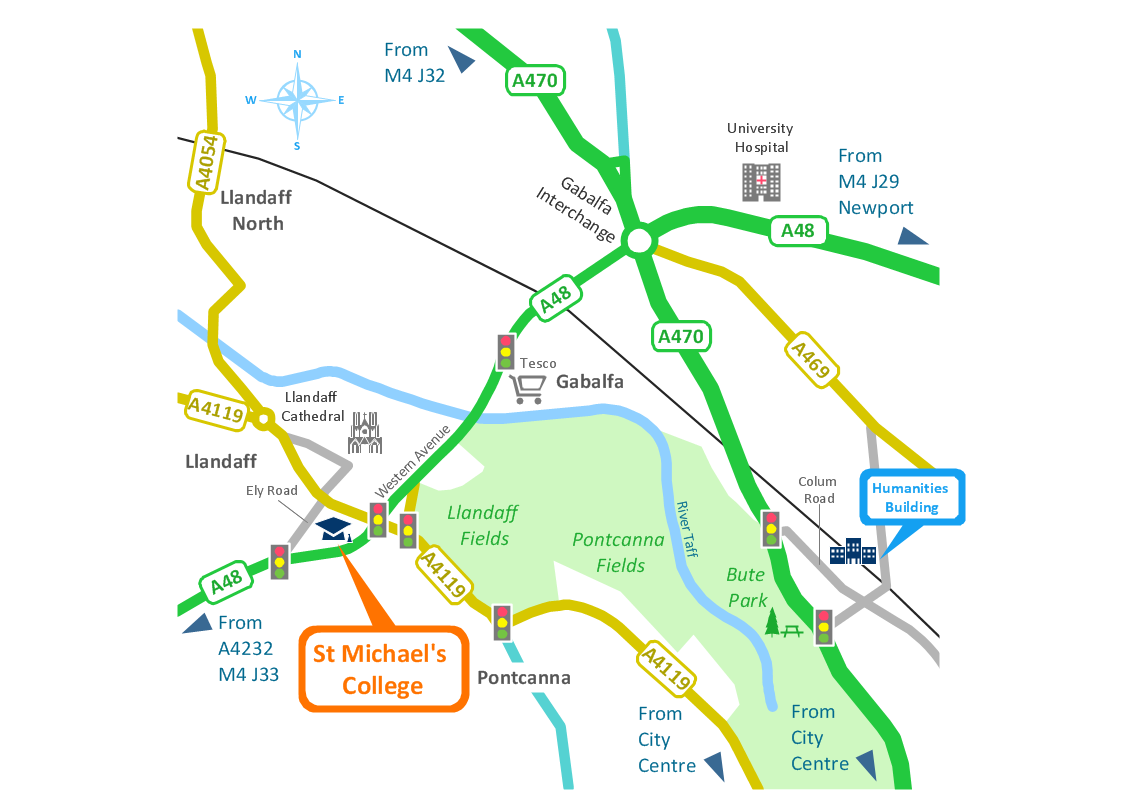
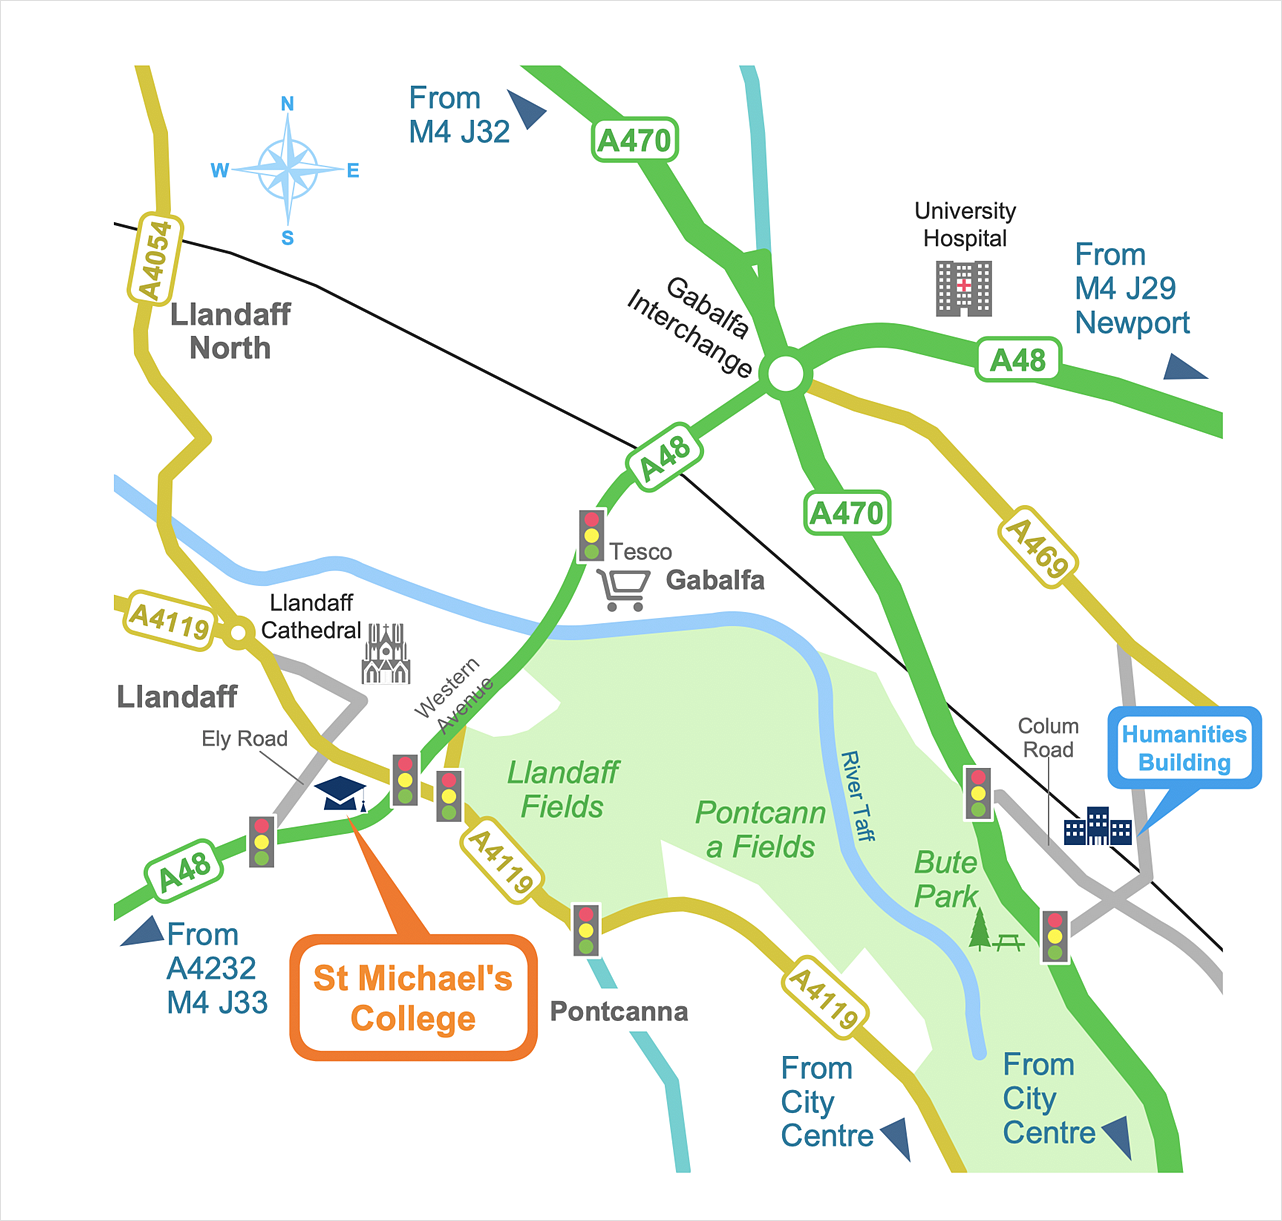
Great examples of Infographic Maps, they are needed for inspiration.Brilliant Examples of Infographics Map, Transport, Road
ConceptDraw DIAGRAM contains spatial infographics samples, map templates to be filled in, and libraries of vector stencils for main design elements of spatial infographics.Map Infographic Tool
ConceptDraw is a data visualization tool, which can help you to create a map infographics. Anyone can do this, it's that easy!Map Infographic Creator
Follow samples and map templates to create nfographic maps. It's super-easy!Map Infographic Maker
Take inspiration with ConceptDraw to visualise your maps and make eye-catching infographics.HelpDesk
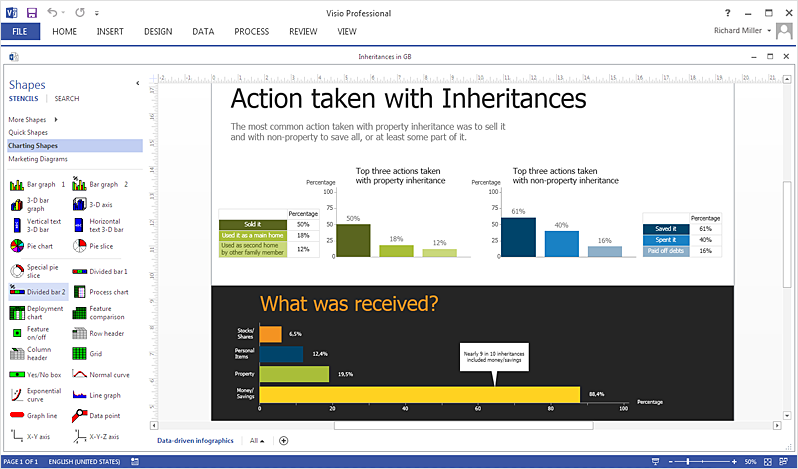
How To Create an MS Visio Data-Driven Infographics
ConceptDraw DIAGRAM allows you to easily create data-driven infographics of any complexity and then make an MS Visio file from your diagram in a few simple steps.Map Infographic Design
ConceptDraw collection of vector elements for infographics design.HelpDesk
How to Create a Typography Infographic
Infographics are a good way to visually share knowledge, to communicate information and illustrate a message. Typography Infographics can help to present at a glance a large pack of complex information in a clear and vivid manner. Designers use the elements of typography Infographics to compose a graphic presentation of information that is intended to depict the information behind the numbers in a creative and interesting visual way. Each infographics element is used to depict and explain an idea of the current portion of information. ConceptDraw DIAGRAM provides the ability to design different kinds of typography infographics. You can use ConceptDraw Typography Infographics solution to create typography infographics effortlessly and quickly using the special set of vector stencils libraries.HelpDesk
How to Create Infographics Using the Spatial Infographics Solution
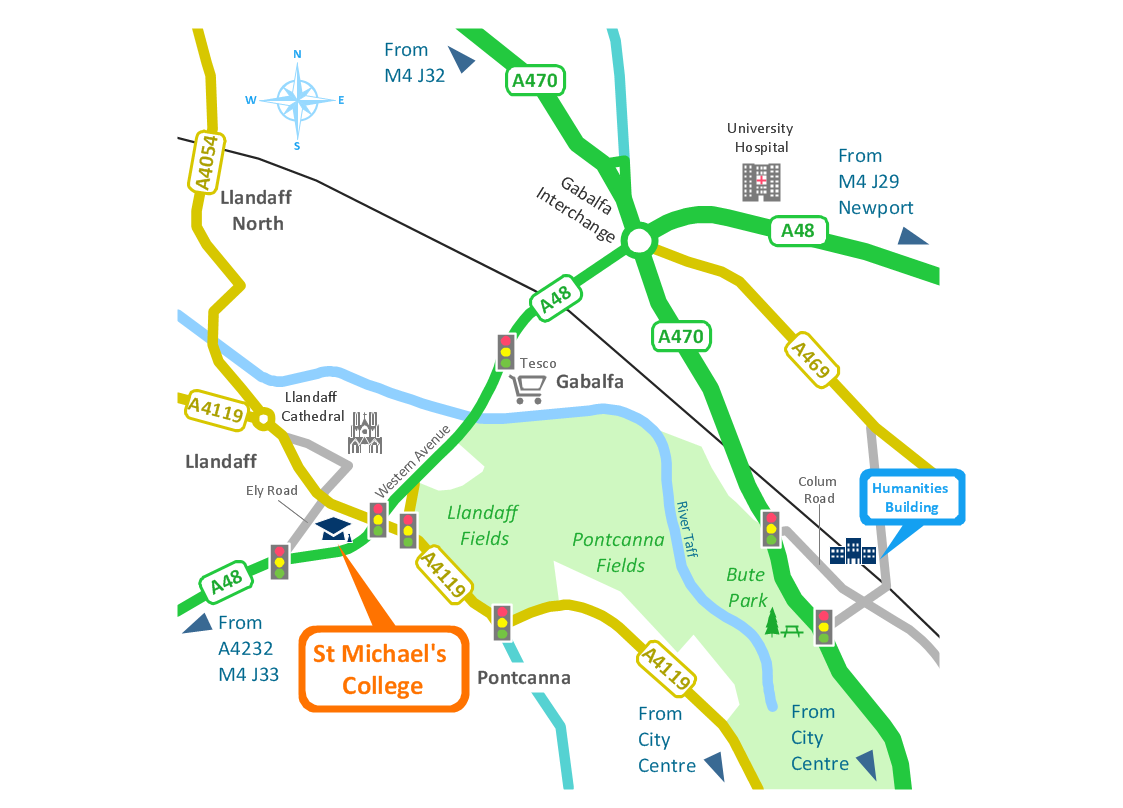
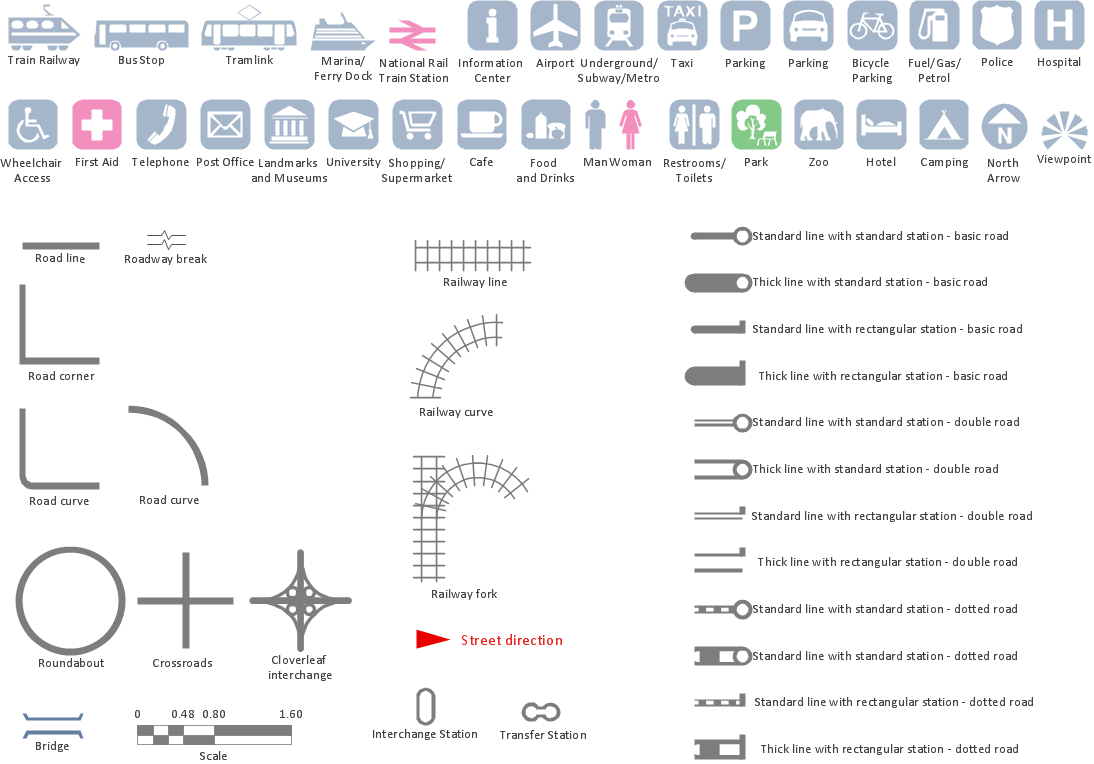
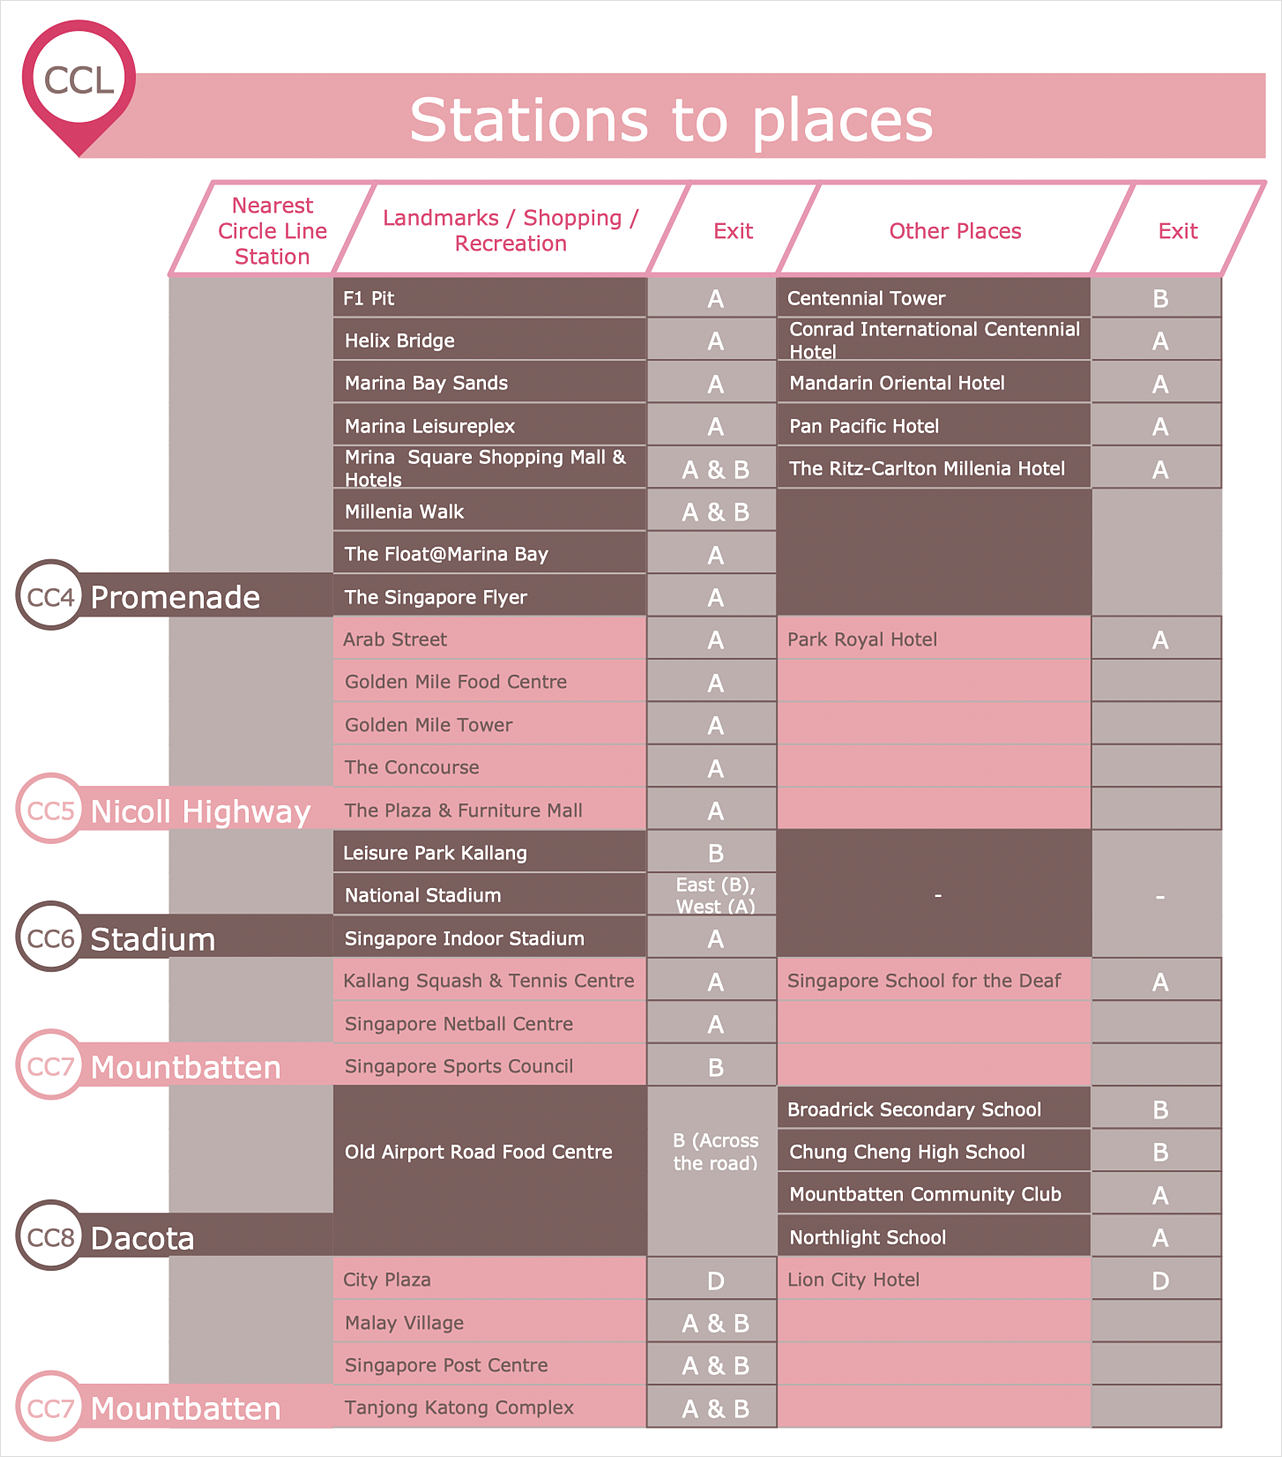
Tips on how to use ConceptDraw Spatial Infographics Solution. Now you got the tool for quick and easy drawing and presenting of your own simple Spatial Infographics documents.Spatial infographics Design Elements: Transport Map
Do you like infographics and data visualization? Creating infographics is super-easy with ConceptDraw.HelpDesk
How to Design a Food-related Infographics
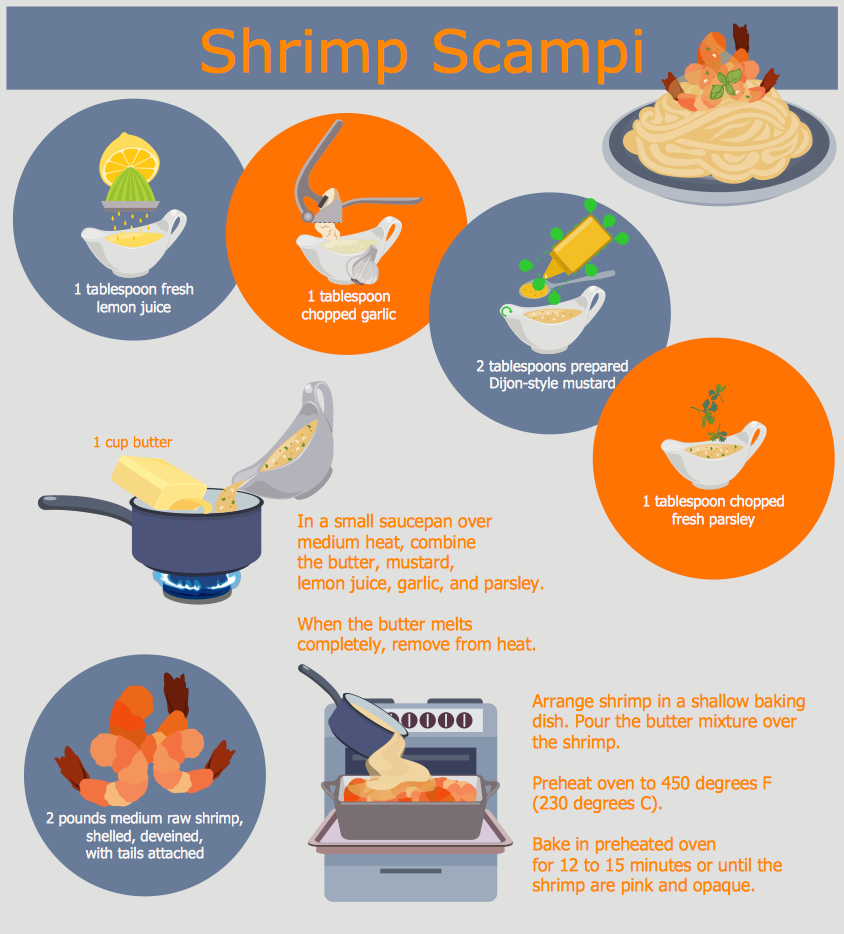
Today a large piece of business is referred to a food. This business can not be imagined without various kinds of visualizations. You can see them everywhere — on brand logos, in advertising, on menus and in flyers. Also different food related infographics is used to promote healthy nutrition and to deliver information on how to maintain an effective diet. ConceptDraw Cooking Recipes solution, offers a great collection of bright food-related images and icons, placed into themed libraries. It can be used for catering menu graphics, on marketing flyers, or as concomitant text for infographics.HelpDesk
How to Create Infographics that Help People Eat Healthy
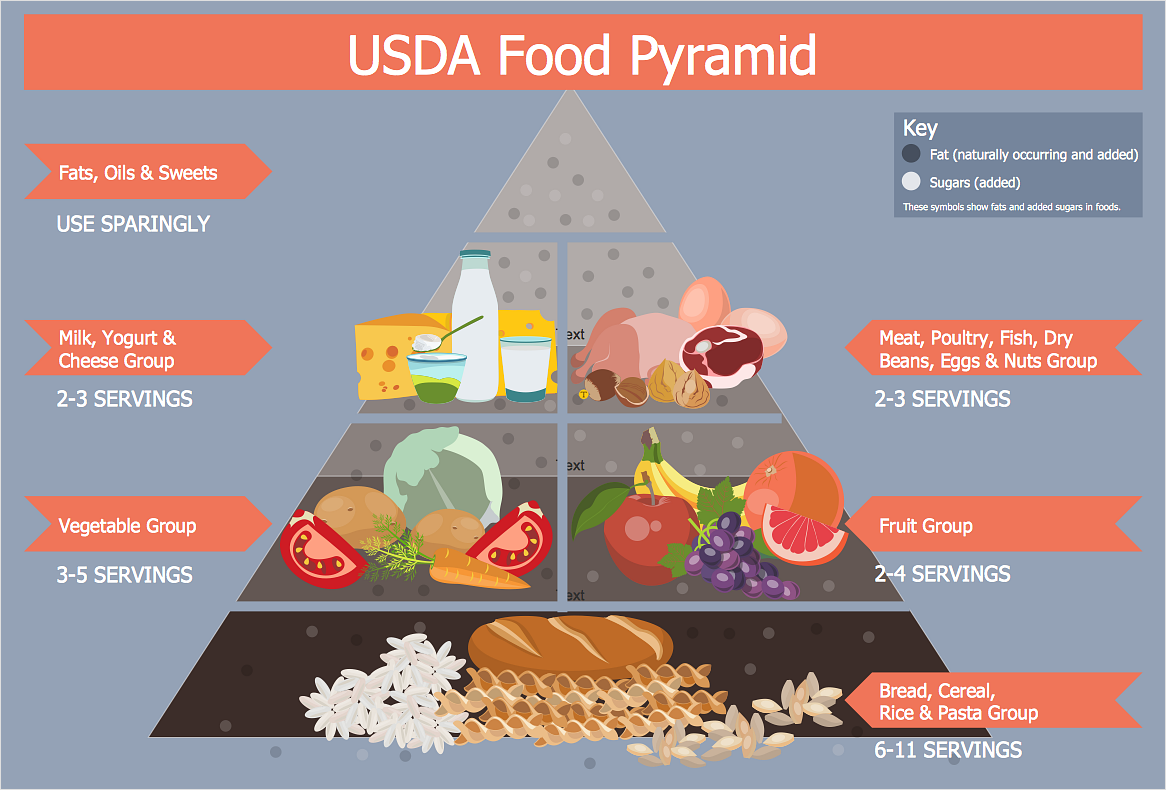
The most effective manner of presenting information on a healthy diet and food nutrition is using various visualizations such as charts or infographics. To help easily create infographics and diagrams of healthy eating, ConceptDraw has provided the Health Food solution to its Solution Park. It contains vector stencil libraries of healthy eating options, samples of diagrams and infographics, and a set of templates to help you create your own diagrams, infographics and even adds. Using ConceptDraw DIAGRAM you can easily create and share healthy food recipes and materials about the proper nutrition.HelpDesk
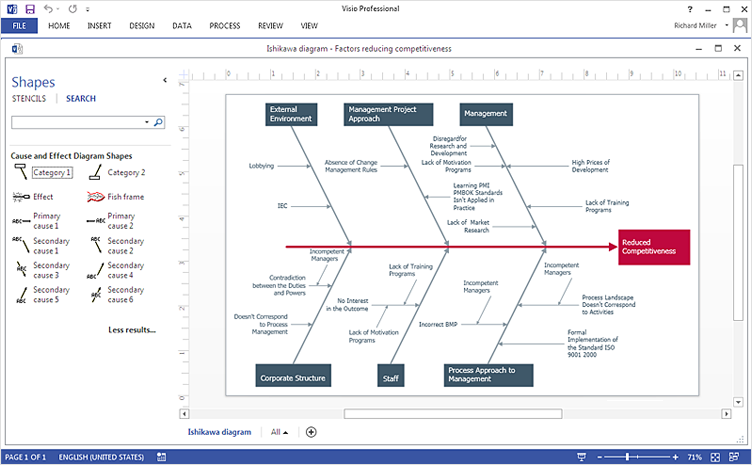
How To Create Cause and Effect (Fishbone) Diagram in MS Visio
Cause-and-Effect Ishikawa Diagram is a graphical method of analysis and cause-effect relationships, a tool in the form of fish bone. It is used to systematically determine the cause of the problem and represent it graphically. The technique is primarily used in the framework of quality management for the analysis of quality problems and their causes. Nowadays, it has found worldwide distribution and is used in multiple problem areas. It is one of the tools of lean manufacturing, which is used in group work to find the problems and their causes. ConceptDraw DIAGRAM allows you to easily create Fishbone (Ishikawa) diagram and then make a MS Visio VSDX, or VSD files from your diagrams in a couple clicks, using the export capabilities of ConcewptDraw DIAGRAM.HelpDesk
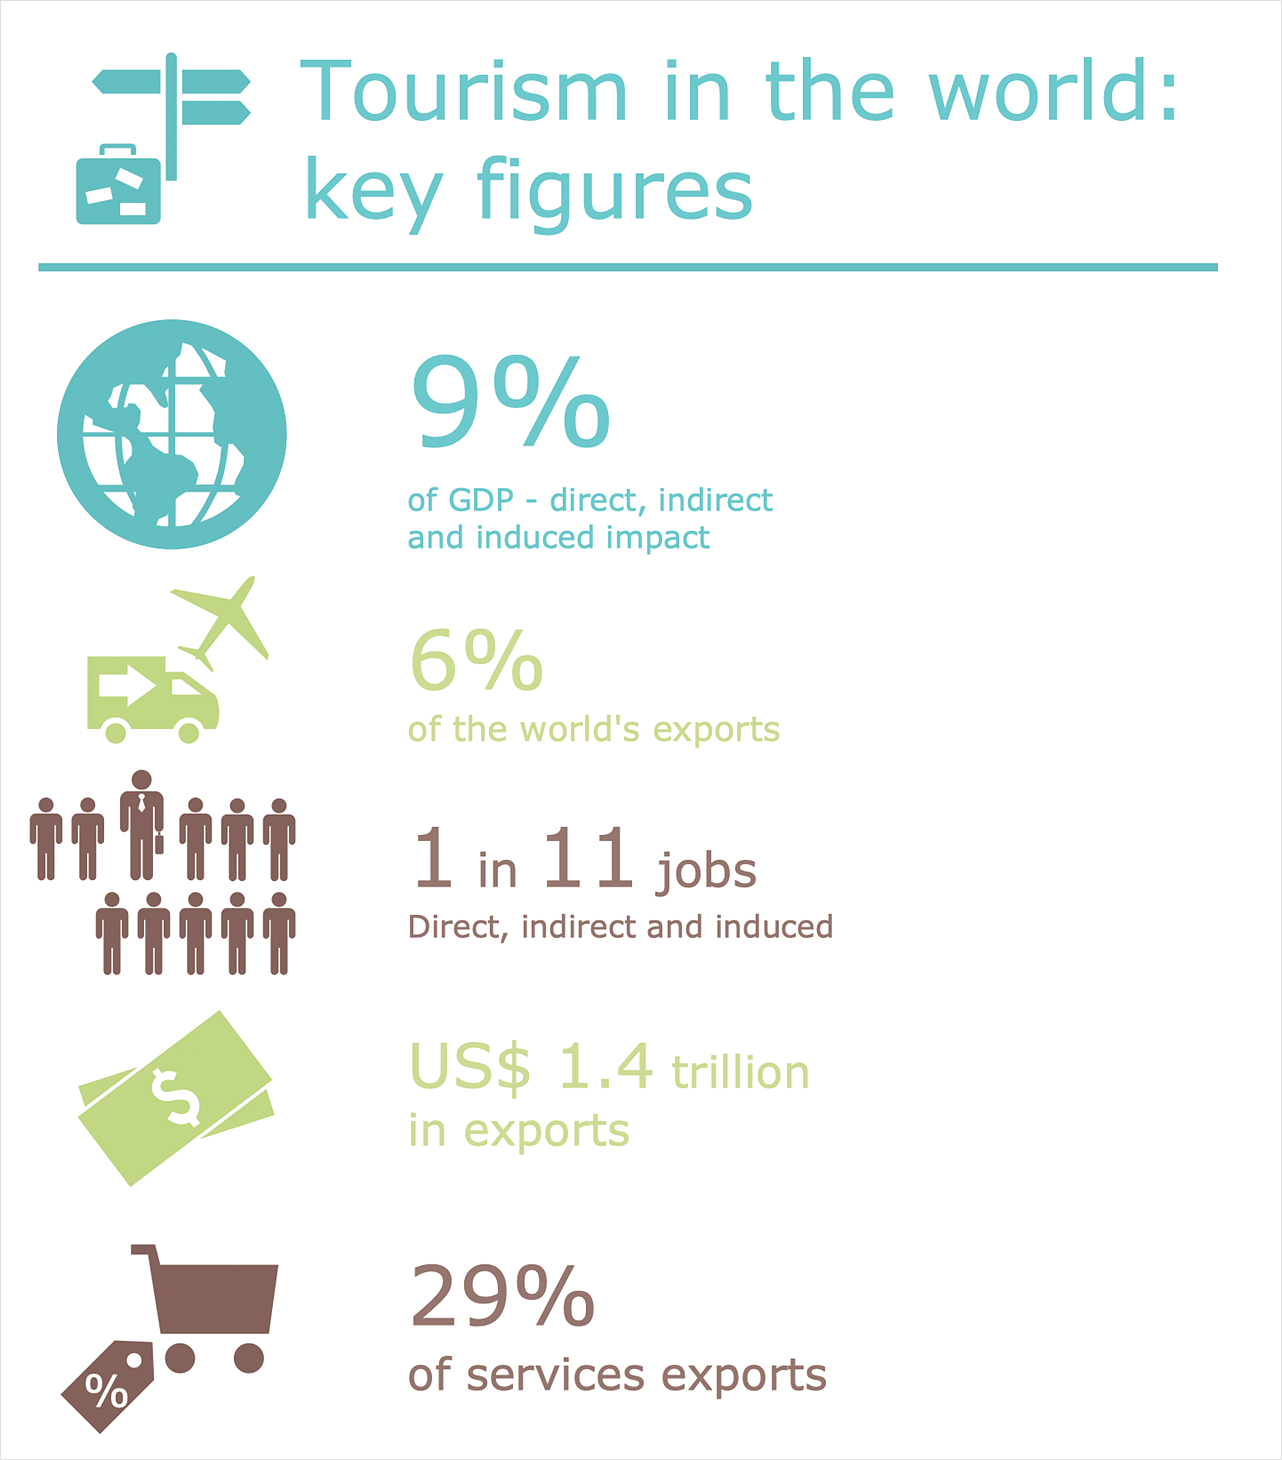
How to Draw a Pictorial Chart
Pictorial Infographics is used to visually present data comparison. Pictorial charts use relative sizes or repetitions of the same icon, picture, or symbol to show data relation. Using a Pictorial chart to show business data patterns and trends will add much more efficiency to your business communications. Finding the right tool for the job can sometimes be tricky. Developing sophisticated and effective infographics can require tools that may span many different products. Fortunately, ConceptDraw DIAGRAM has everything you need to create polished Pictorial Infographics that beautifully and accurately represent your story, no matter how complex it may be.Flowchart design. Flowchart symbols, shapes, stencils and icons
A flowchart is a type of diagram which represents an algorithm, process or workflow, displays the steps as boxes of various kinds and depicts their order by connecting them with arrows. Any business graphic document will be more colorful and understandable if will use professional-looking and visual diagrams and flowcharts. Flowchart design gives versatile presenting and explaining of the process. ConceptDraw DIAGRAM flowchart software enhanced with Flowcharts solution helps effectively make Flowchart Design. Use of predesigned flowchart symbols and bright color palette offers a fresh view and favorably distinguishes the flowcharts designed in ConceptDraw DIAGRAM from the black and white flowcharts on a paper. Preferably to use no more than three or four colors and apply identical for the same shape types. The best flowchart design can be achieved by starting with Flowchart template, or any of suitable ready examples or samples offered in ConceptDraw STORE, open one of them and enter the proper text into each Flowchart shape. Each symbol of the flowchart has a definition that can't be changed. This means that all flowcharts shapes can be grouped in according to their meaning. Users with ConceptDraw DIAGRAM flowchart software can style groups of symbols with close definitions by color sets chosen from complementary palette. Almost all workflows can be depicted as a flowchart. Colored diagrams are more light for perception of the certain information, this is part of flowchart design. Bright colors need to be used in the key points of Decision symbols, to focus attention on their importance for whole process flow.
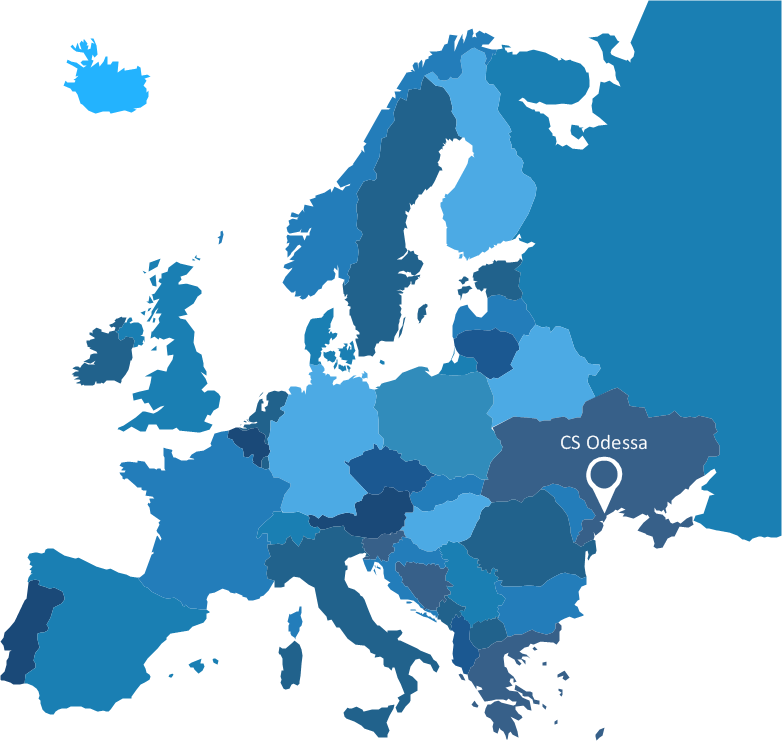
Visualization Spatial Data Using Thematic Maps Combined with Infographics
Now anyone can build an infographics from their data using ConceptDraw. Nice and simple, but the features it have are power-packed!- Visio Traffic Light Stencil
- Map Directions | How to Create a Directional Map Using ...
- Visio Stencil Toilet
- Directional Maps | Geo Map - World | Spatial Infographics | Visio ...
- Public Transportation Visio Stencil
- Organic Chemistry Symbols | Education pictograms - Vector stencils ...
- How to Convert MS Visio Custom Stencil to ConceptDraw DIAGRAM ...
- Visio Infographic Template
- Visio Stencils Data Outlets
- Warehouse Stencil Visio
- Solar Visio Stencils
- Visio Stencil Bluetooth
- HR arrows - Vector stencils library | What are Infographics Area ...
- How to Convert a Visio Stencils for Use in ConceptDraw PRO ...
- Basic Flowchart Symbols and Meaning | Marketing - Vector stencils ...
- How to draw Metro Map style infographics ? (New York) | How to ...
- Brilliant Examples of Infographics Map, Transport, Road | Best Tool ...
- Strategy Clock Template | Time - Design Elements | Electrical ...
- Music - Vector stencils library | Cloud clipart - Vector stencils library ...


