HelpDesk
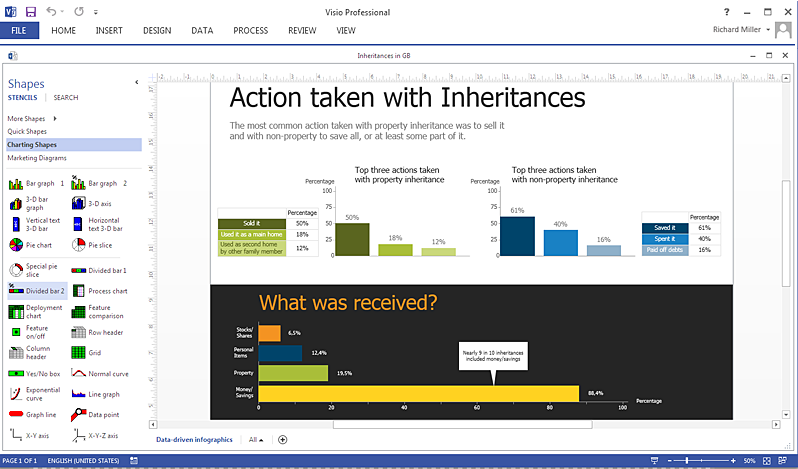
How To Create an MS Visio Data-Driven Infographics
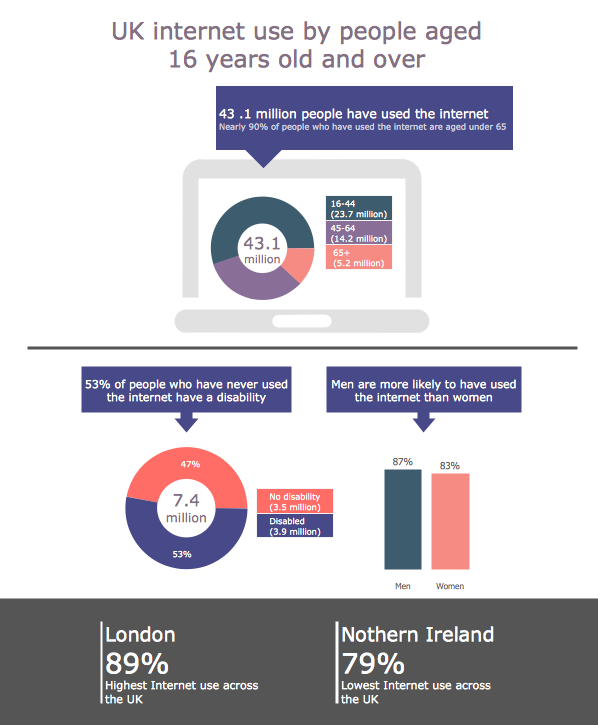
ConceptDraw DIAGRAM allows you to easily create data-driven infographics of any complexity and then make an MS Visio file from your diagram in a few simple steps.HelpDesk
How To Make Visio Circle-Spoke Diagram
Circle-Spoke Diagram consists of a central round balloon, which is circled with other balloons as a ring. The Circle-Spoke Diagram is usually used in marketing. It shows the relationships between entities and the central element. Circle-Spoke Diagram can be used in marketing documentation and presentations. ConceptDraw DIAGRAM allows you to easily create marketing charts of any complexity, including the circle-spoke diagram and then make an MS Visio file from your diagram in a few simple steps. You can easily design your business documentation and share it easily with MS Visio users.Business Report Pie. Pie Chart Examples
This sample shows the Business Report Pie Chart. The Pie Chart visualizes the data as the proportional parts of a whole, illustrates the numerical proportion. Pie Charts are very useful in the business, statistics, analytics, mass media.Table Seating Chart Template
The arrangement of tables and seating charts near them have great value in many premises and situations. It is often very convenient to draw a plan before the furniture arrangement. ConceptDraw DIAGRAM software offers the Seating Plans solution from the Building Plans area for fast and easy drawing the table seating chart template and samples.Spider Chart Template
This sample shows the Spider Chart that represents the budget and spending for one organization and allows to compare them. The multivariate data are represented on the Spider Chart as a two-dimensional chart with four or more variables displayed on the axes that start in one point. The Spider Charts are used in the management, business and sport.HelpDesk
How To Create Visio Bubble Chart
ConceptDraw DIAGRAM allows you to easily create business charts and diagrams of any complexity, including the bubbles diagram and then make a MS Visio file from your diagram in a few simple steps.HelpDesk
How To Create MS Visio Cross-Functional Flowchart
Cross-functional is a process involving several functional layers. Such processes typically cause the most problems, and therefore, is the most potential for improvement. Cross-functional business processes usually illustrate the processes of product development, commercial proposal development, the order execution process - everything, that involves several departments. The package of possible improvements - is the task of re-engineering. To illustrate the cross-functional processes often use cross-functional flowchart is often used to illustrate the cross-functional processes. ConceptDraw DIAGRAM allows you to easily create a cross-functional flowchart. Then, you can export it to MS Visio VSDX or VDX format and successfully share it with your colleagues still using MS Visio.Best Tool for Infographic Construction
ConceptDraw is a best data visualization tool that will allow everyone to create rich infographics and visualizations quickly and easily.HelpDesk
How To Create a Concept Map in Visio
ConceptDraw DIAGRAM allows you to easily create concept maps and then make an MS Visio file from your diagrams in a few simple steps.Infographic software: the sample of New York City Subway map
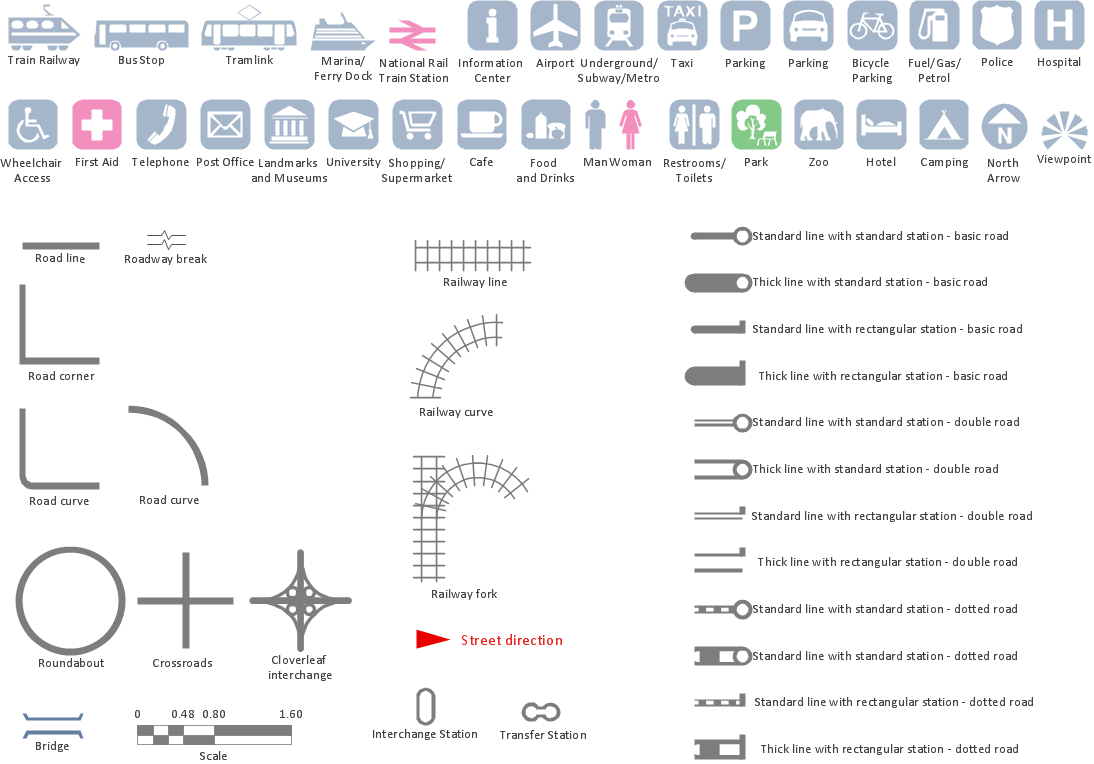
Tool to draw Metro Map styled inforgraphics. New York City Subway map sample.Data Infographics
The popularity of visual Data Infographics grows day by day. So it would be nice to have effective software for their quick and easy creating. ConceptDraw DIAGRAM extended with Data-driven Infographics Solution from the “Infographics” Area of ConceptDraw Solution Park is exactly what you need.Typography Art
Typography Infographics Solution for ConceptDraw Solution Park is the best answer on the question “How to create an Infographic?”. The Typography Infographics created in ConceptDraw DIAGRAM using the Typography Infographics Solution are the real typography art.Network Concepts
ConceptDraw DIAGRAM diagramming and network drawing software extended with Network Layout Floor Plans Solution from the Computer and Networks Area is the best for visually representing and explaining the basic network concepts.How to Create an Infographic
How to Create an Infographic? It’s very easy! All what you need is a powerful infographic software. Never before creation of Infographics wasn’t so easy as now with Typography Infographics Solution from the “Infographics” Area for ConceptDraw Solution Park.The vector stencils library "Circular diagrams" contains 42 templates of circular diagrams: circular arrow diagram, circular motion diagram, arrow ring chart, doughnut chart (donut chart), circle pie chart, diamond pie chart, circle diagram, pie chart, ring chart, loop diagram, block loop diagram, arrow loop circle, crystal diagram, triangular diagram, diamond diagram, pentagon diagram, hexagon diagram, heptagon diagram, cycle diagram (cycle chart), stacked Venn diagram (onion diagram), arrow circle diagram.
Use these shapes to illustrate your marketing and sales documents, presentations, webpages and infographics in the ConceptDraw PRO diagramming and vector drawing software extended with the Target and Circular Diagrams solution from the Marketing area of ConceptDraw Solution Park.
www.conceptdraw.com/ solution-park/ marketing-target-and-circular-diagrams
Typography Infographic Examples
ConceptDraw DIAGRAM extended with Typography Infographics Solution from the “Infographics” Area is a powerful infographic software that offers you variety of infographics examples. Use of predesigned examples as the base for your own Typography Infographics is a timesaving and useful way. Simply open the desired example, change for your needs and then successfully use it in any field of your activity.This vector stencils library contains 195 cloud computing icons.
Use it to design cloud computing infographic and diagrams with ConceptDraw PRO software.
"Cloud computing, also on-demand computing, is a kind of Internet-based computing that provides shared processing resources and data to computers and other devices on demand. It is a model for enabling ubiquitous, on-demand access to a shared pool of configurable computing resources (e.g., networks, servers, storage, applications and services), which can be rapidly provisioned and released with minimal management effort. Cloud computing and storage solutions provide users and enterprises with various capabilities to store and process their data in third-party data centers.
Cloud computing has become a highly demanded service or utility due to the advantages of high computing power, cheap cost of services, high performance, scalability, accessibility as well as availability." [Cloud computing. Wikipedia]
The vector stencils library "Cloud clipart" is included in the Cloud Computing Diagrams solution from the Computer and Networks area of ConceptDraw Solution Park.
The vector stencils library "Education pictograms" contains 128 education pictograms. Use this flat icon set to design your educational infogram in ConceptDraw PRO diagramming and vector drawing software.
The vector stencils library "Education pictograms" is included in the Education Infographics solution from the Business Infographics area of ConceptDraw Solution Park.
The vector stencils library "Cisco network topology" contains 89 symbols of Cisco network devices and design elements for drawing computer network topology diagrams.
"There are two basic categories of network topologies:
(1) Physical topologies,
(2) Logical topologies.
The shape of the cabling layout used to link devices is called the physical topology of the network. This refers to the layout of cabling, the locations of nodes, and the interconnections between the nodes and the cabling. The physical topology of a network is determined by the capabilities of the network access devices and media, the level of control or fault tolerance desired, and the cost associated with cabling or telecommunications circuits.
The logical topology in contrast, is the way that the signals act on the network media, or the way that the data passes through the network from one device to the next without regard to the physical interconnection of the devices." [Network topology. Wikipedia]
The symbols example "Cisco network topology - Vector stencils library" was created using the ConceptDraw PRO diagramming and vector drawing software extended with the Cisco Network Diagrams solution from the Computer and Networks area of ConceptDraw Solution Park.
www.conceptdraw.com/ solution-park/ computer-networks-cisco
- How to draw Metro Map style infographics ? (New York) | Subway ...
- Pie Donut Chart. Pie Chart Examples | Donut Chart Templates
- Project Timeline | How to Make a Timeline | Visio Timeline Templates
- Process Flowchart | Basic Flowchart Symbols and Meaning | Types ...
- How To Create a MS Visio Data-driven Infographics Using ...
- Best Tool for Infographic Construction | Visio Infographic Stencil
- Cisco people - Vector stencils library | Visio Stencil Persons
- Timeline Examples | Project Timeline | Timeline Diagrams | Visio ...
- Radar Chart | Percentage Spider Chart | Spider Chart | Radar Visio
- Directional Maps | Tools to Create Your Own Infographics | Visio 3d ...