This site uses cookies. By continuing to browse the ConceptDraw site you are agreeing to our Use of Site Cookies.

Visio Files and ConceptDraw

Visio Files and ConceptDraw. ConceptDraw DIAGRAM is compatible with MS Visio.VDX formatted files.VDX is Visio’s open XML file format, and it can be easily imported and exported by ConceptDraw DIAGRAM.

MS Visio Look a Like Diagrams

No need for any special drawing skills to create professional looking diagrams outside of your knowledge base. ConceptDraw DIAGRAM takes care of the technical details, allowing you to focus on your job, not the drawing. ConceptDraw DIAGRAM delivers full-functioned alternative to MS Visio. ConceptDraw DIAGRAM supports import of Visio files. ConceptDraw DIAGRAM supports flowcharting, swimlane, orgchart, project chart, mind map, decision tree, cause and effect, charts and graphs, and many other diagram types.

Active Directory, network topology, Active Directory Domain Active Directory Diagrams

Active Directory, network topology, Active Directory Domain
Active Directory Diagrams solution significantly extends the capabilities of ConceptDraw DIAGRAM software with special Active Directory samples, convenient template and libraries of Active Directory vector stencils, common icons of sites and services, icons of LDPA elements, which were developed to help you in planning and modelling network structures and network topologies, in designing excellently looking Active Directory diagrams, Active Directory Structure diagrams, and Active Directory Services diagram, which are perfect way to visualize detailed structures of Microsoft Windows networks, Active Directory Domain topology, Active Directory Site topology, Organizational Units (OU), and Exchange Server organization.

ConceptDraw DIAGRAM Comparison with Omnigraffle Professional and MS Visio

ConceptDraw DIAGRAM comparison with Omnigraffle Professional and MS Visio shows you the significant benefits of ConceptDraw DIAGRAM , which offers varied useful drawing tools, the capability of creation multi-page documents, wide export / import capabilities in graphics formats, integration with Visio and Microsoft Office applications, availability of built-in scripting language and ConceptDraw Solution Park with numerous solutions, vector objects libraries, templates and samples. Business today is conducted with incredible rate and dynamic presentations become very popular. Sometimes while conducting the business, may happen that you can't describe some situation, state, or process with only words. In these cases, it is convenient to include graphics and diagrams associated with the text. This guarantees successful communication with other stakeholders and team members, and faultless understanding the information by them. The combination of words and graphics is an ideal combination, it improves the clarity and removes any doubt. ConceptDraw DIAGRAM helps you easily create any kinds of diagrams and dynamic presentations too.

OMT Method

This sample shows the OMT method. It was created in ConceptDraw DIAGRAM diagramming and vector drawing software using the Rapid UML Solution from the Software Development area of ConceptDraw Solution Park. All diagrams produced with ConceptDraw DIAGRAM are vector graphic documents and are available for reviewing, modifying, and converting to a variety of formats (image, HTML, PDF file, MS PowerPoint Presentation, Adobe Flash or MS Visio XML).
HelpDesk

How To Create a CRM System Dashboard

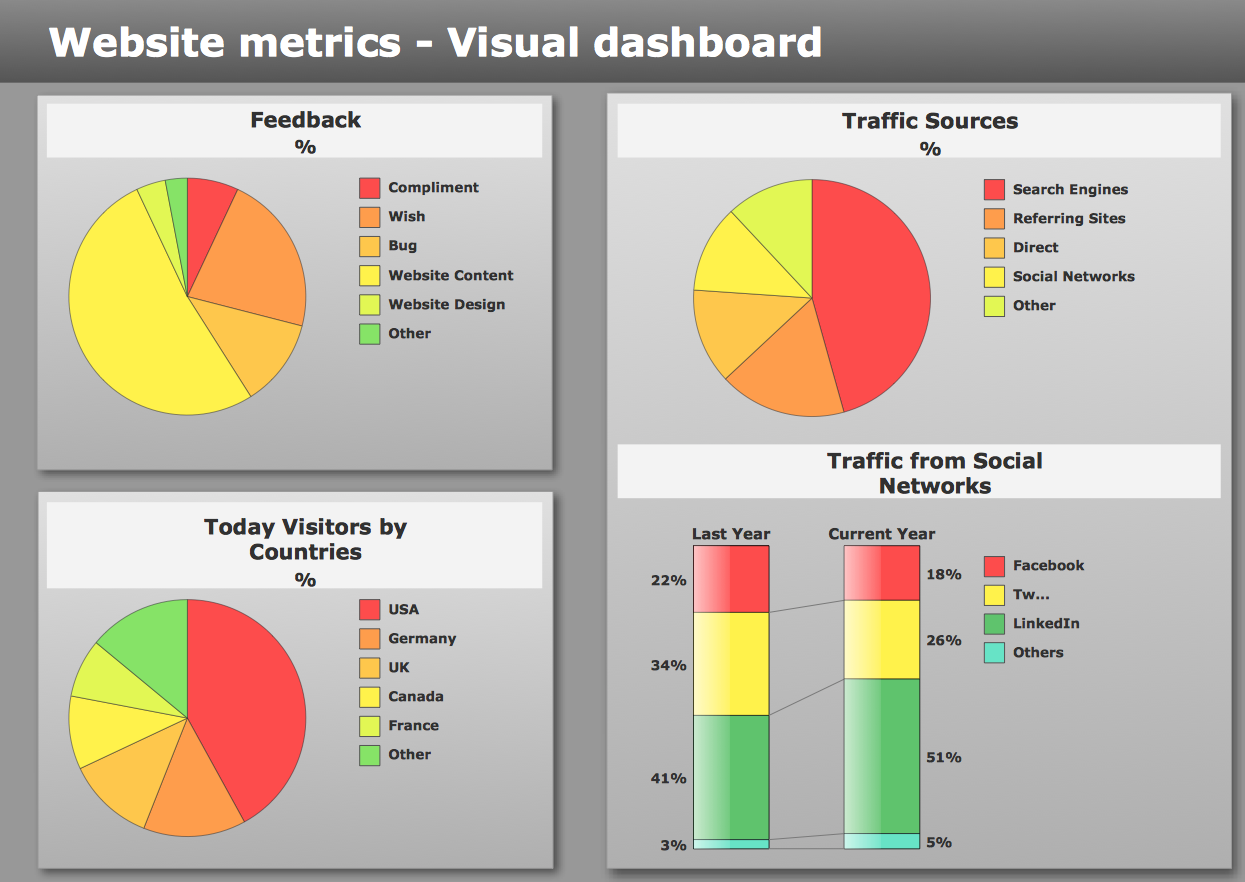
Succeed in drawing the CRM Dashboards and CRM Center Dashboards depicting current and actual companies information and data with ConceptDraw DIAGRAM CRM software supplied with CRM Center Dashboard solution.
HelpDesk

How to Use ConceptDraw Dashboard for Facebook on PC

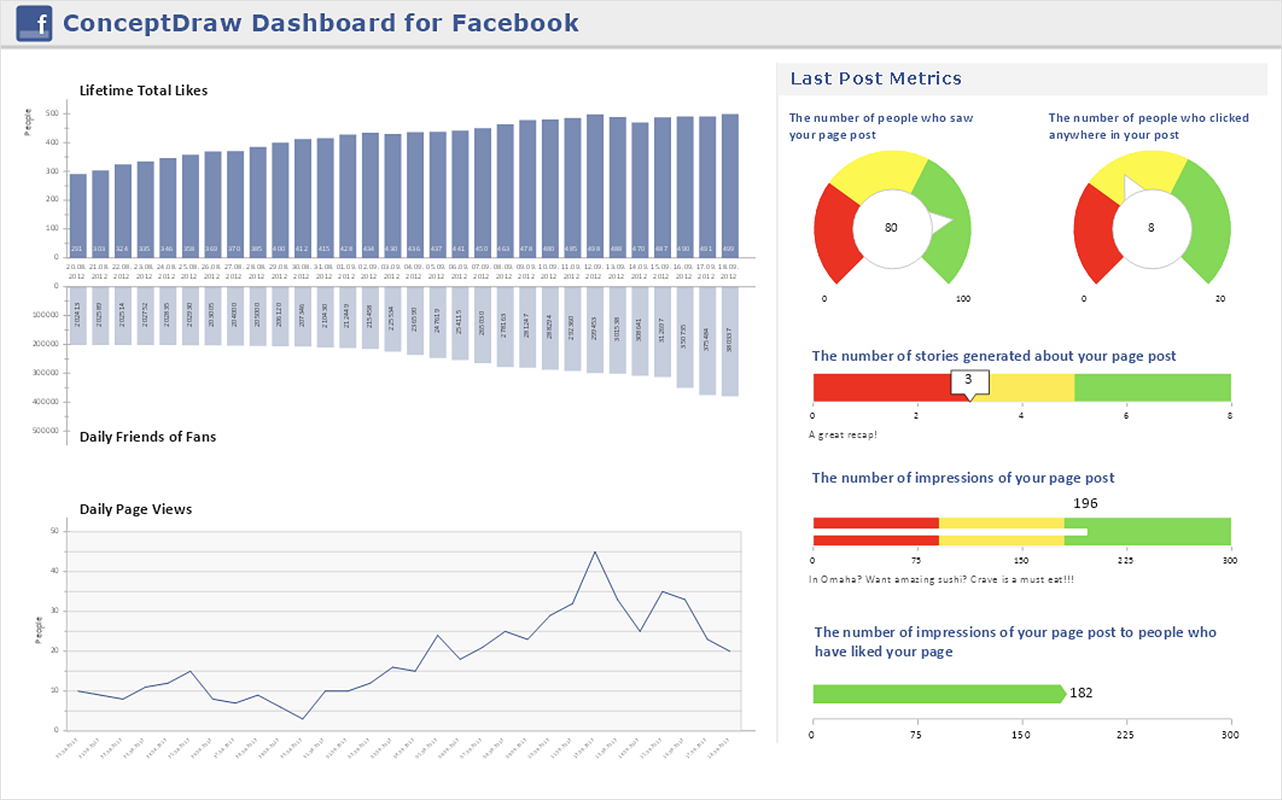
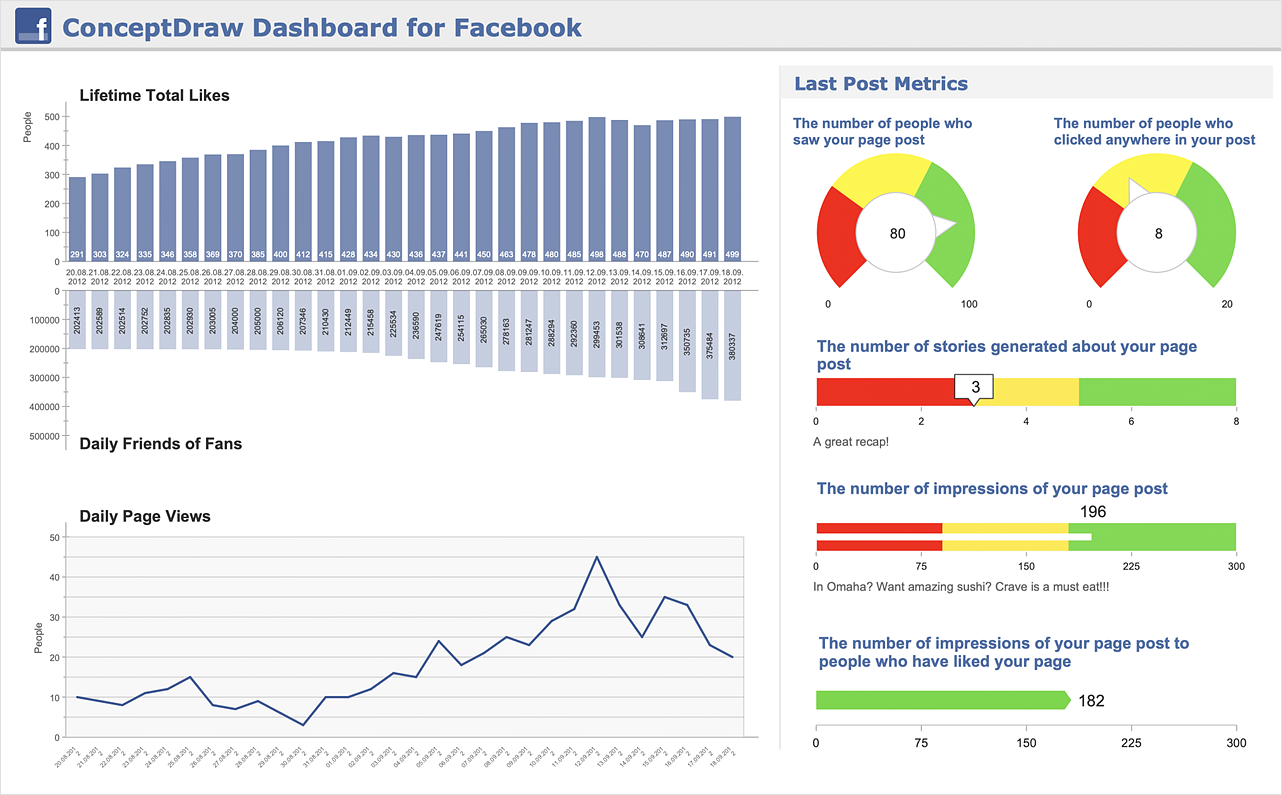
The ConceptDraw Dashboard for Facebook Solution is a visual dashboard that visualizes lifetime total Likes, daily Friends of Fans, and daily Page views based on the information exported from your Facebook Page.

How to Construct a Fishbone Diagram

Fishbone, Ishikawa or Cause and Effect diagram helps understand the reasons of completed or potential actions by structuring their causes in smaller categories. Also, one can use it to see how the contributing factors are related to each other. In everyday company routine, a Cause and Effect diagram is helpful with a number of regular activities like brainstorming, project management, and problem solving. How to Construct a Fishbone Diagram? Construction a Fishbone diagram in professional diagramming software ConceptDraw DIAGRAM is more easy than you think. Just use the predesigned vector elements from the Fishbone Diagrams library for Fishbone Diagrams solution or one of plenty Fishbone templates and examples, and you will get a Cause and Effect diagram in minutes.
HelpDesk

How To Create an HR Metric Dashboard

Human Resources dashboards can be used for analyzing hr workflow in an organization and identifying points for improvement. They are useful to HR managers, and for C level executives. HR dashboard helps to monitor HR KPIs. Thus Decision makers will ensure that company strategy is aligned from an executive, to managerial, to individual goals. HR Dashboard Solution for ConceptDraw DIAGRAM allows you to see what information you need from each KPI to see if your Human Resources management performs accurate and cost-efficient.
HelpDesk

How to Make a Logistic Dashboard

Logistics and supply chain data represented in the view of the dashboard can show the real picture of the logistic management activity of the organization. It can display important logistics KPIs like Supply chain performance measures, warehouse statistics, and more logistics KPIs. The dashboard provides managers, marketers, and analysts to improve the management of financial, informational, internal and external material flows and processes. The logistics dashboard ensures the precise accounting of document and goods turnover, logistics infrastructure and logistic costs. It helps to improve the management of financial, informational, internal and external material flows and processes. Logistics Dashboard Solution for ConceptDraw DIAGRAM allows you to see what information you need from each logistics KPI to see if your logistic process performs fast, accurate and cost-efficient.
The vector stencils library "SysML diagrams" contains 19 symbols.
Use it to design your SysML diagrams using ConceptDraw PRO diagramming and vector drawing software.
"The Systems Modeling Language (SysML) is a general-purpose modeling language for systems engineering applications. It supports the specification, analysis, design, verification and validation of a broad range of systems and systems-of-systems.
SysML was originally developed by an open source specification project, and includes an open source license for distribution and use. SysML is defined as an extension of a subset of the Unified Modeling Language (UML) using UML's profile mechanism." [Systems Modeling Language. Wikipedia]
The building blocks example "Design elements - SysML diagrams" is included in the SysML solution from the Software Development area of ConceptDraw Solution Park.
SysML diagram building blocks
SysML diagram building blocks, viewpoint, view, refine, realization, rationale , public package import, problem, private package import, package diagram, package containment, package, model, dependency, constraint textual note, constraint note, conform, comment,

Plant Design Solutions

The use of the special software with Plant Design Solutions is a real help for effective creating the Plant Plan, Plant Layout Plan, Process Plant Layout, Plant Design. ConceptDraw DIAGRAM is the best diagramming and vector drawing software. It offers the Plant Layout Plans Solution from the Building Plans Area for achievement this goal.

Playground Layouts

You need quickly design Playground Layouts? Use the tools of Sport Field Plans solution from the Building Plans area of ConceptDraw Solution Park to depict any of your ideas for the Playground Layouts.

Windows Azure

The Microsoft Windows Azure platform is a highly flexible cloud-based solution with variety of services which supports not only the execution of.NET applications, but also allows developers to use programming languages like Java, PHP, Node.js, or Python. ConceptDraw DIAGRAM diagramming and vector drawing software provides the Azure Architecture Solution from the Computer and Networks area of ConceptDraw Solution Park with a lot of useful tools which make easier: illustration of Windows Azure possibilities and features, describing Windows Azure Architecture, drawing Azure Architecture Diagrams, depicting Azure Cloud System Architecture, describing Azure management, Azure storage, documenting Azure services.

Network Security Tips

The Internet is a huge world with unlimited possibilities. But with all its numerous advantages, the Internet also conceals many dangers and security threats, that's why we advise you to follow simple network security tips. ConceptDraw DIAGRAM diagramming and vector drawing software supplied with Network Security Diagrams Solution from the Computer and Networks Area of ConceptDraw Solution Park is an ideal software for easy designing Network Security Diagrams and attractive illustrations with effective network security tips.

Business Process Modeling Software for Mac

ConceptDraw DIAGRAM - business process modeling software for mac offers the Business Process Diagram Solution with powerful tools to help you easy represent the business processes and create the business process diagrams based on BPMN 1.2 and BPMN 2.0 standards that allows to create of both simple and complex (nested) models of processes.

ERD, entity-relationship diagram, ER-diagram, Chen Notation Chen Notation

ERD, entity-relationship diagram, ER-diagram, Chen Notation
The Chen Notation solution extends ConceptDraw DIAGRAM software with rich collection of ERD samples and selection of special Chen's notation icons for effective database design, data modeling, and visual representation of relationships between the entities on the ER diagrams designed with Chen notation.